GuruFocus Excel Add-In
GuruFocus Excel Add-in allows users to download and retrieve historical stock financial data, guru portfolio data, economic indicator data and industry overview data using a fully-customizable add-in platform. The add-in provides up to 30 years of historical data on over 90,000 stocks from around the globe, over 8,000 institutional investors and more than 4,600 economic indicators.
* Compatible with Office 365 (Windows, Mac and web) or Windows Office 2021+. If you are using earlier version of Office, please use old version of GuruFocus Excel Add-in
Other Platforms
Fully customizable research on Excel
GURUF Function: Retrieve Historical Stock Financial Data
The GURUF function works with common Excel functions like SUM, AVERAGE and COUNT that allow for deeper analysis on financial data on over 90,000 stocks around the globe. One click refreshes the data, allowing users to retrieve stock financial data without leaving the Excel Add-in.
Examples:
=GURUF(“AAPL”,”Price”) gives Apple’s current price.
=GURUF(“AAPL”,”Revenue”,”-15”,”A”) gives Apple’s revenue over the past 15 years.
=GURUF(“AAPL”,”Net Income”,”2021”,”Q”) gives Apple’s net income for each quarter in 2021.
=GURUF(“AAPL”,”Total Assets”,”2010:2020”,”A”) gives Apple’s total assets for each year from 2010 to 2020.
=GURUF(“AAPL”,”Per Share Data”,”-30”,”A”) gives the entire per share data table for Apple over the past 30 years.
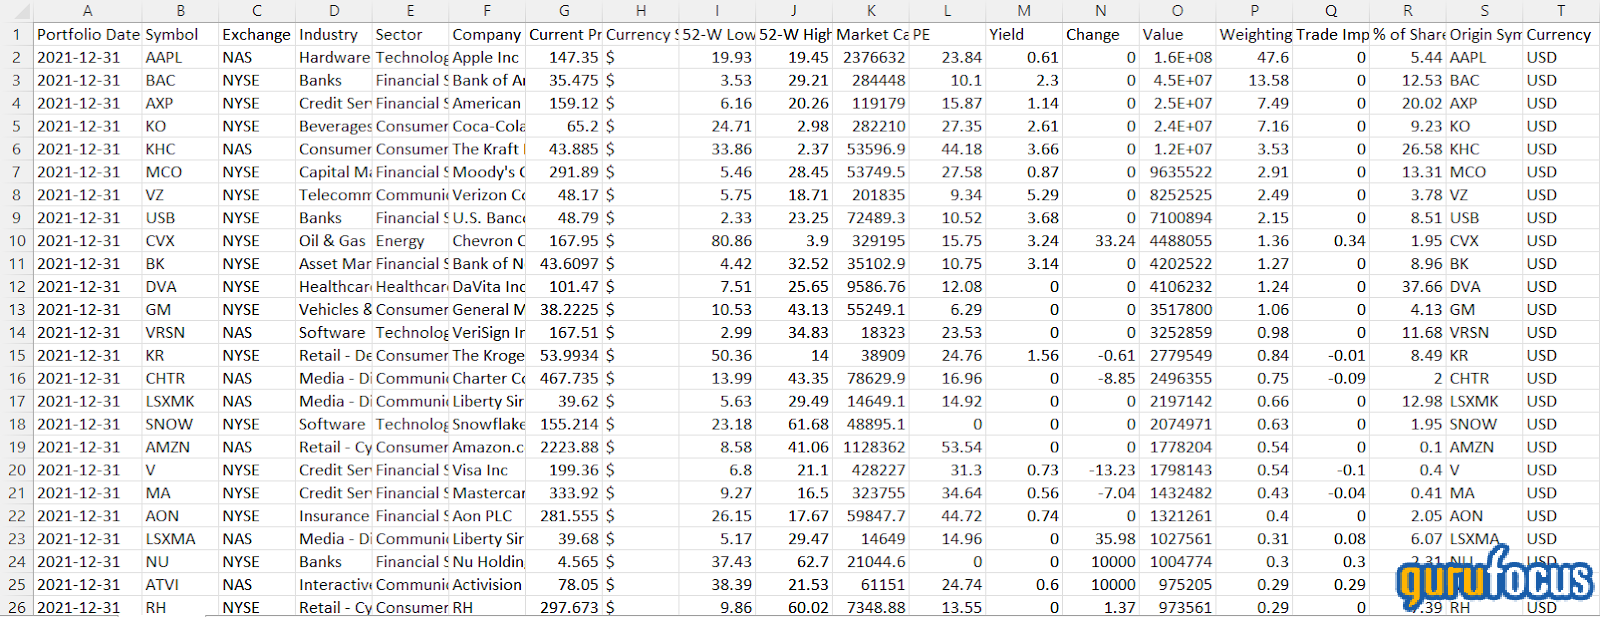
GURUG Function: Retrieve Guru Portfolio Data
The GURUG function retrieves trades and portfolio data on more than 8,000 financial institutions and over 15,000 mutual funds directly into Excel, allowing for further analysis on a guru’s trade history. One click refreshes the data, allowing users to retrieve guru portfolio data without leaving the Excel Add-in.
-> Guru Portfolio Data:
A snapshot of a guru’s 13F portfolio holdings at a specific portfolio filing date
-> Guru Trade Data: View a guru’s trade history as of a specified starting date:
Examples:
=GURUG(“Warren Buffett”,”Portfolio”) gives Warren Buffett’s most-recent 13F equity portfolio.
=GURUG(“Warren Buffett”,”Buy”,”2021-03-31”) gives Warren Buffett’s new buys since the March 2021 quarter.
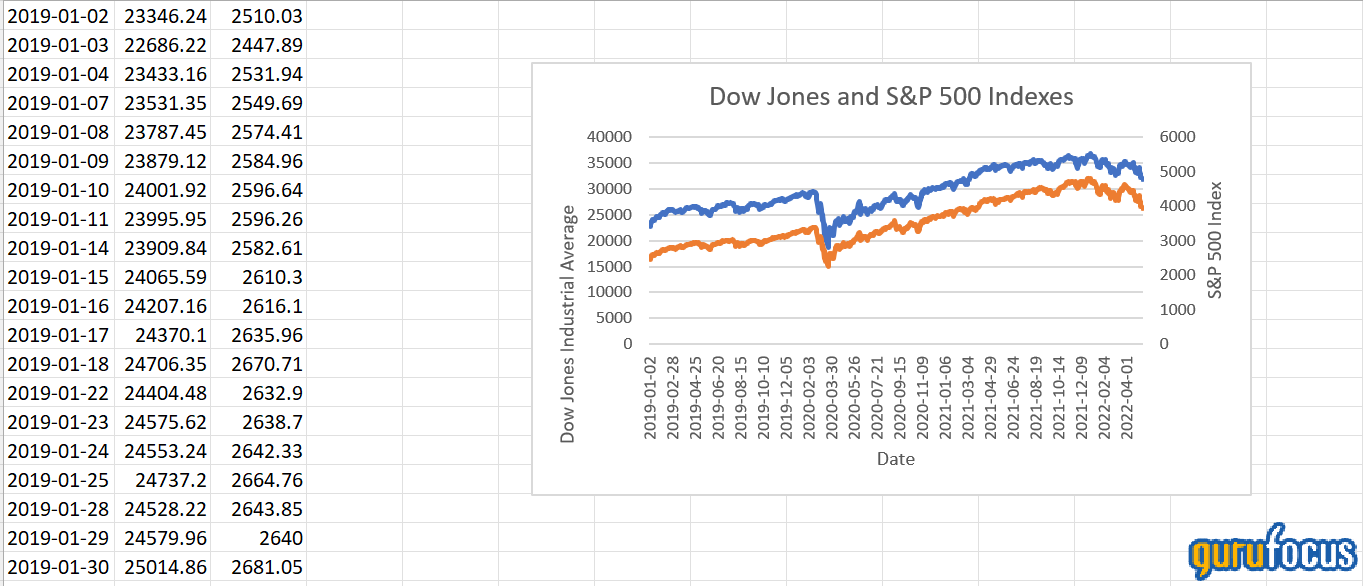
GURUE: Retrieve Economic Indicator Data
The GURUE function allows you to retrieve data on over 4,600 economic indicators like price indexes, commodity prices, foreign exchange rates, gross domestic product and market valuation indicators.
Examples:
=GURUE(“10-Year Treasury Constant Maturity Rate”) gives the current 10-year Treasury constant maturity rate.
=GURUE(“S&P 500 Index”,”2019:”) gives the S&P 500 index prices since 2019.
=GURUE(“WTI Crude Oil”,”2019:2021”) gives the WTI Crude Oil prices from 2019 to 2021.
GURUI: Industry Overview / Median Data
The GURUI function allows you to retrieve data on the industry-median figures for a specific industry group.
Examples:
=GURUI(“USA”,”Technology Overall”,”PE Ratio”) gives the current industry median price-earnings ratio for U.S. technology stocks.
=GURUI("USA", "Retail - Cyclical", "Operating Margin %", "2019:") gives the industry-median operating margin for U.S. cyclical retail companies for each quarter since 2019.
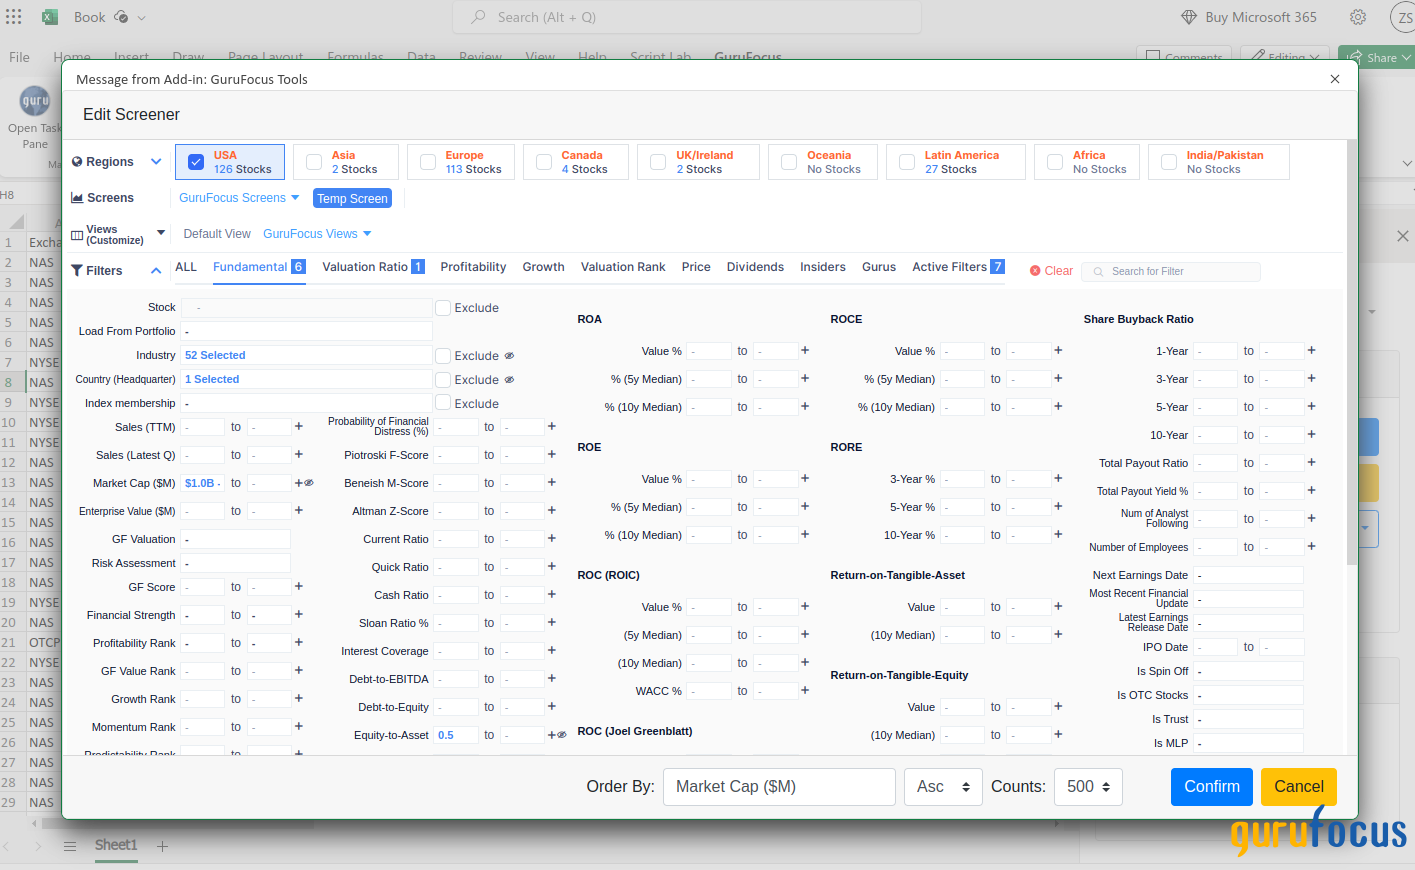
All in one Screener (Premium Plus)
Unlock the power of comprehensive stock screening and analysis right within Microsoft Excel with our latest Excel add-in feature. We are thrilled to introduce the GuruFocus Stock Screener, a seamless integration of GuruFocus.com's renowned stock screening capabilities into your Excel workspace.
Usage:
To initiate the creation of a screener, simply click the "Create/Edit Screener" button. A dialog containing the comprehensive All-in-One screener will appear, allowing you to customize your filters. After setting your desired criteria, click the "Confirm" button, and the screener will be generated, with the corresponding data automatically loaded into your worksheet.
See how GuruFocus Excel Add-in can help you invest from start to finish
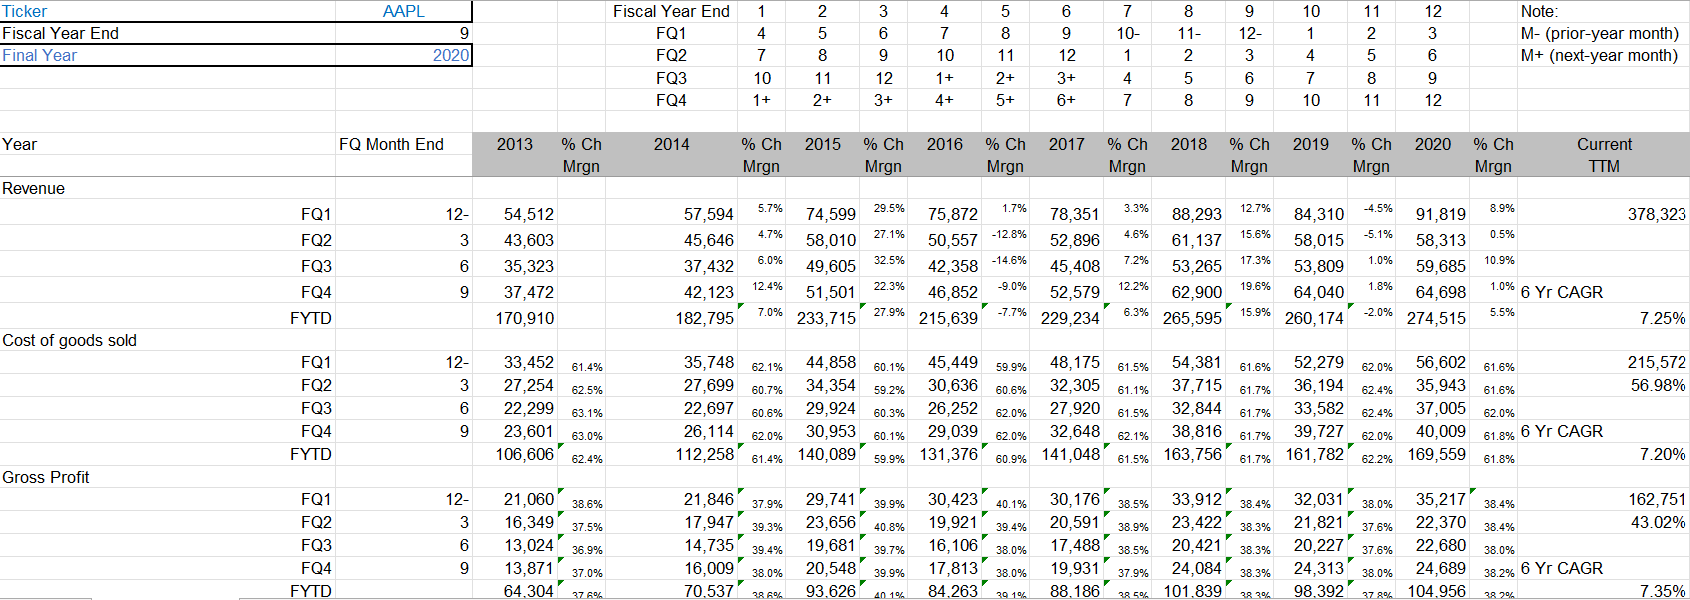
Financials Template
View income statement and cash flow statement data across several fiscal-year quarters. The template also reports a six-year growth rate.
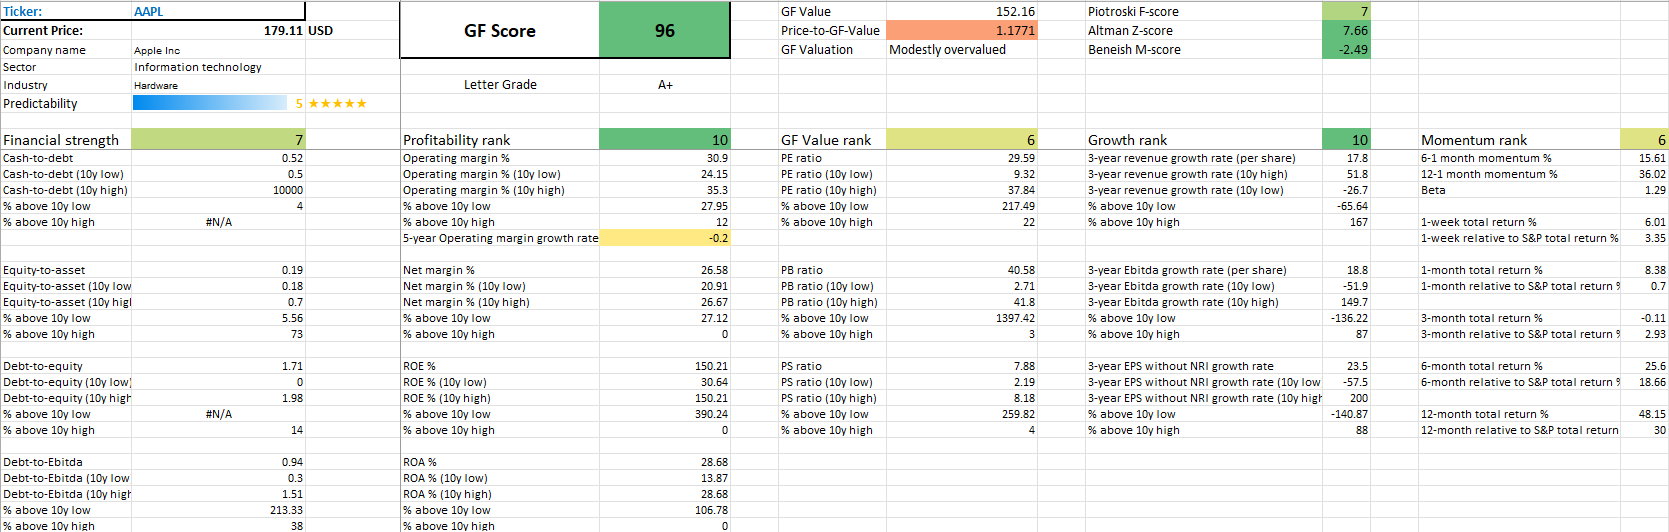
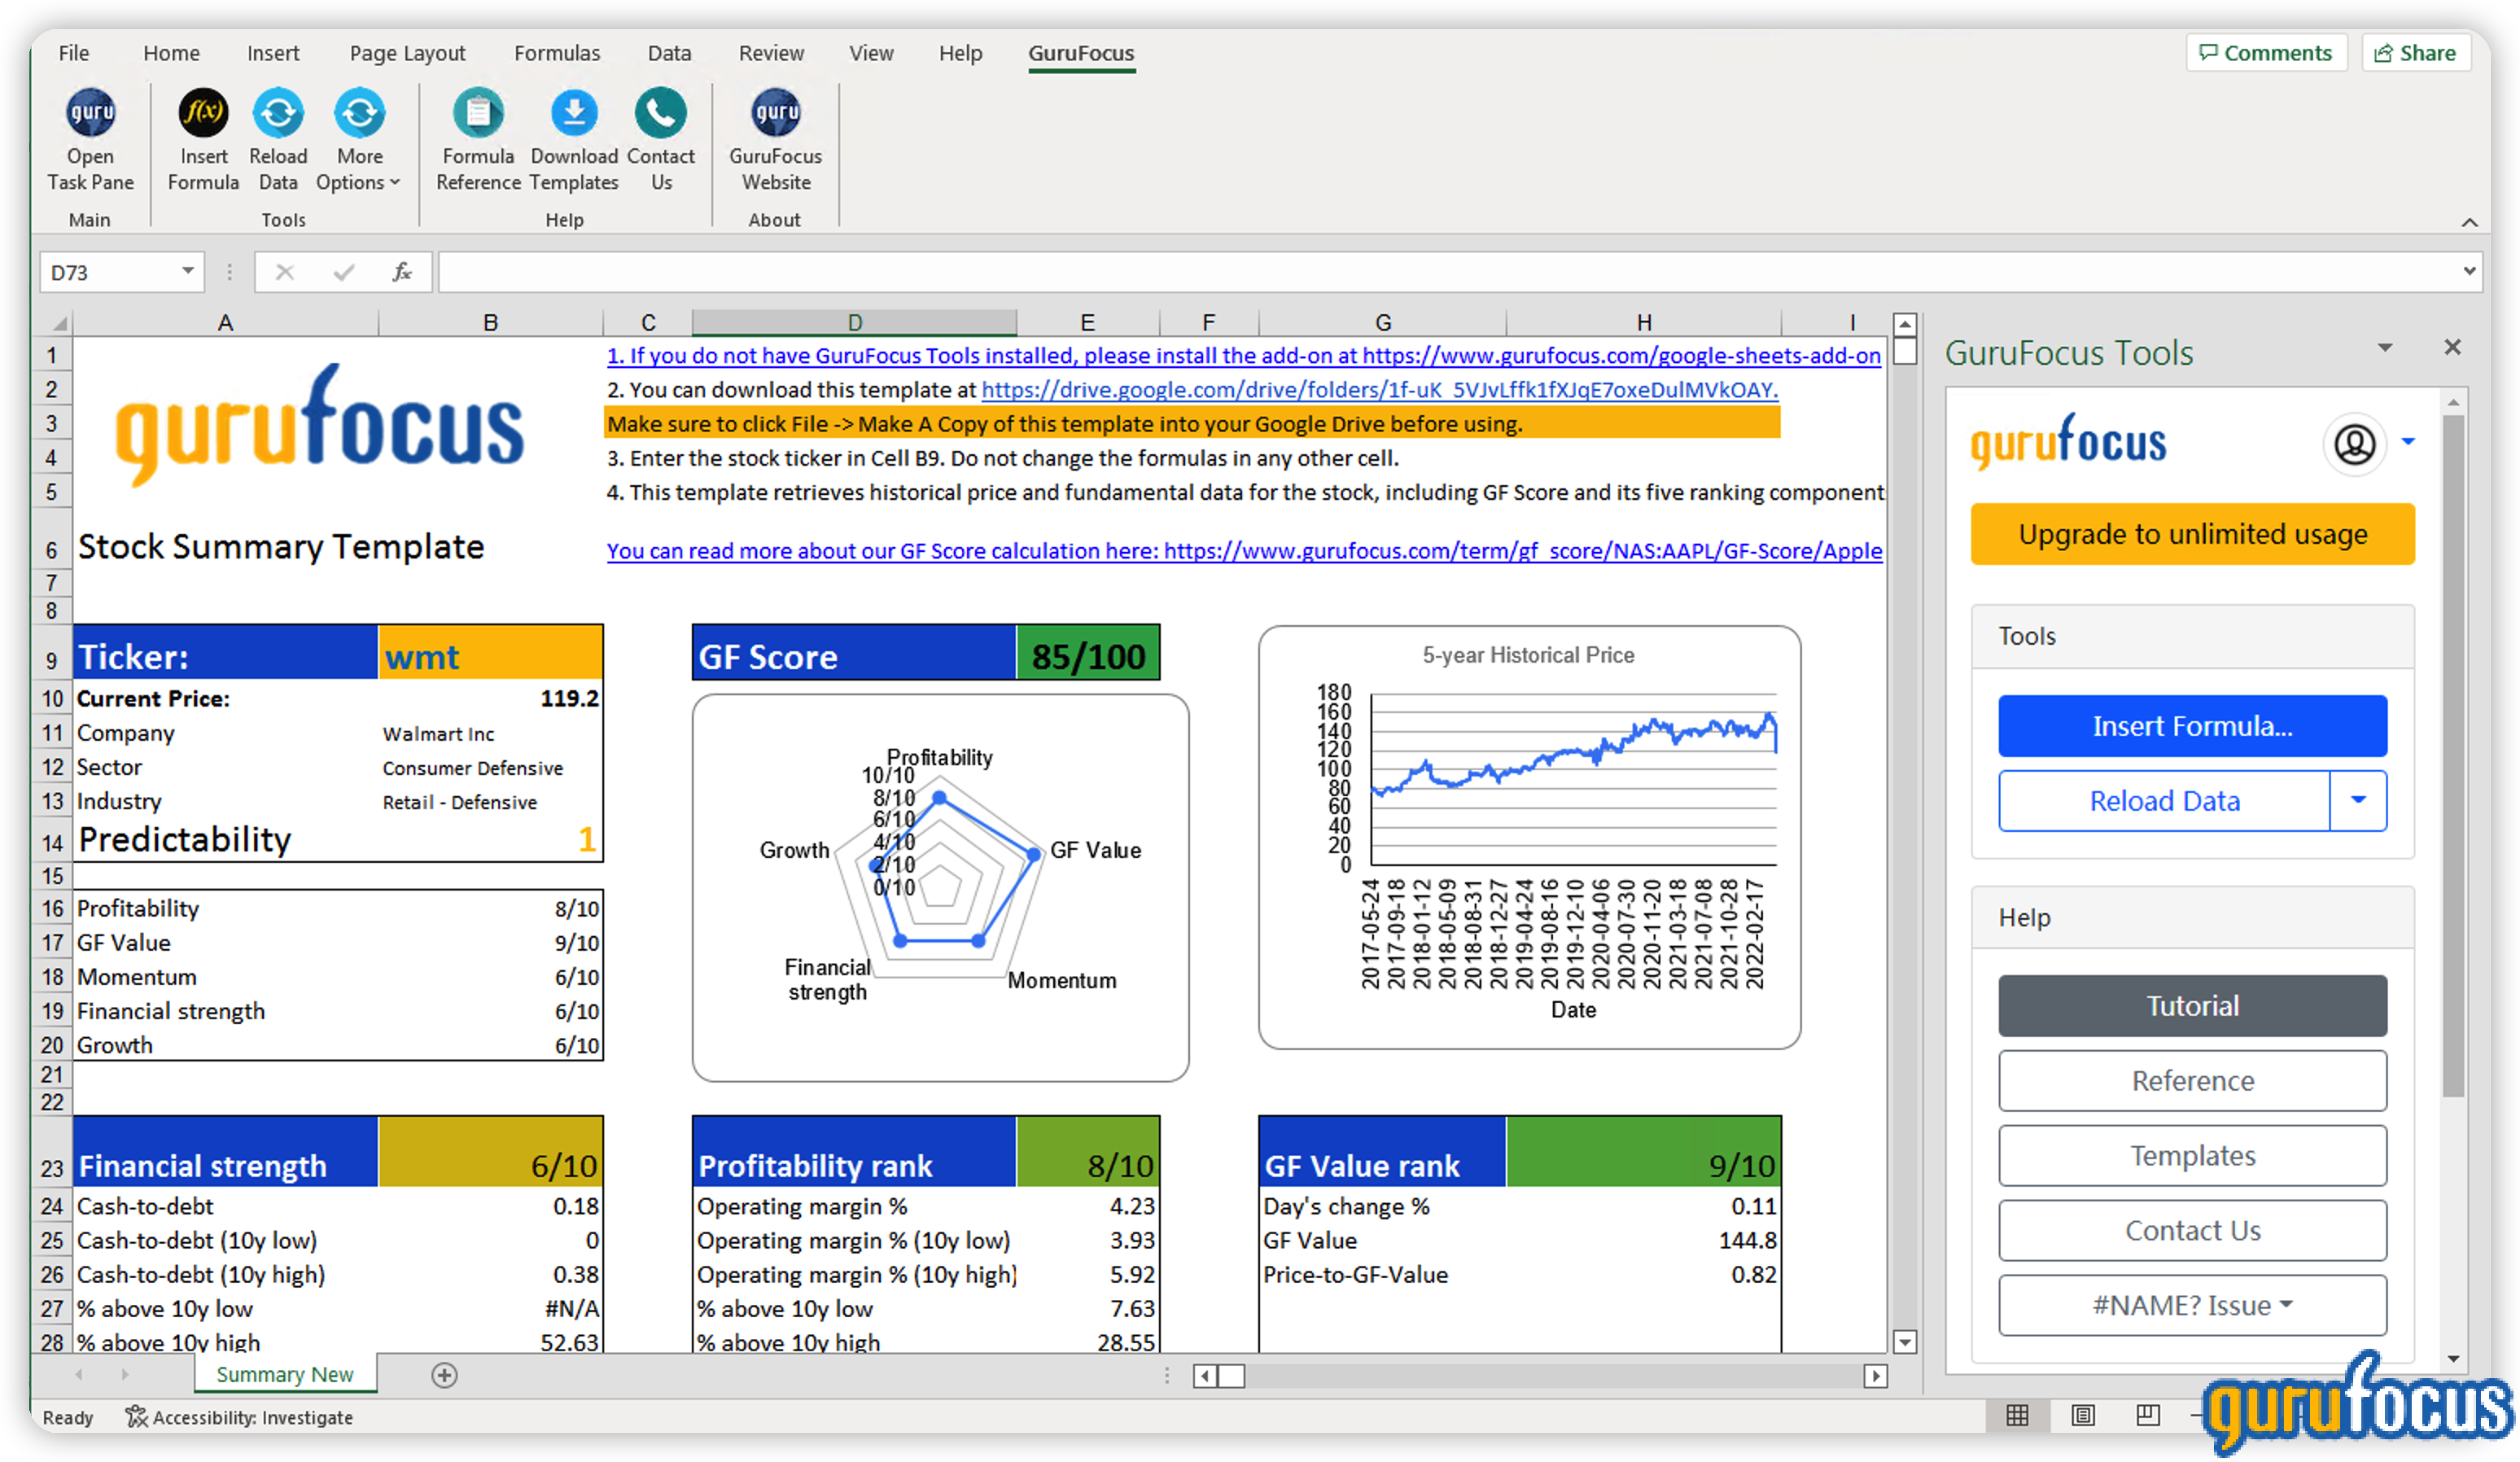
Key Fundamental Data Summary
View key fundamental data for a stock, including GF Score, Financial Strength, Profitability, GF Value, Growth and Momentum metrics.
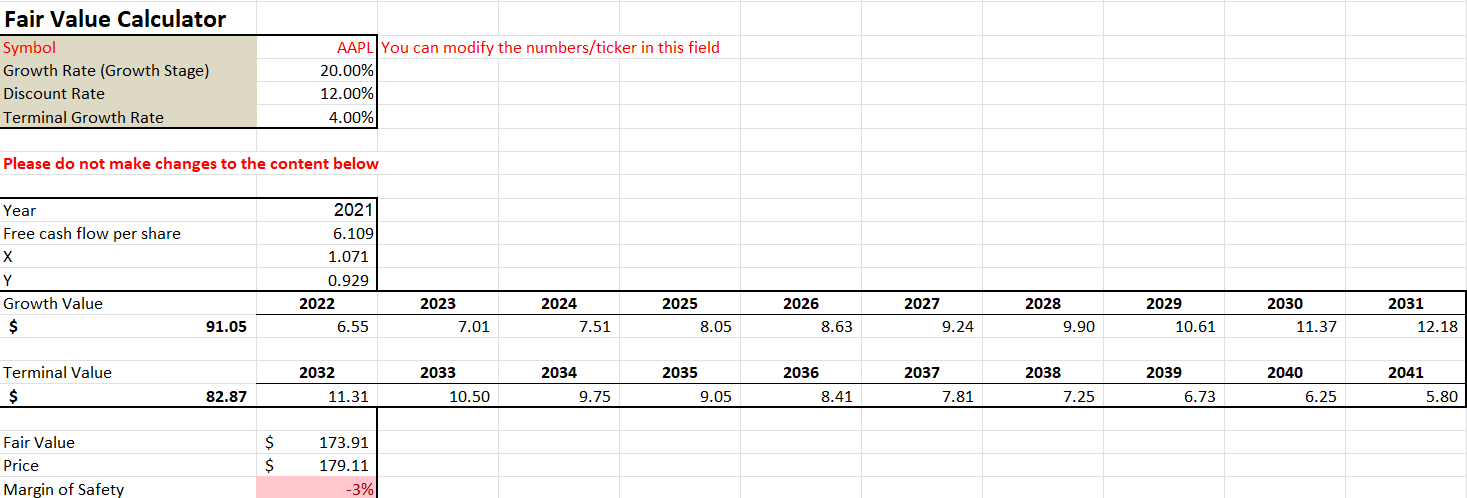
Fair Value Calculator Template
Calculate a stock’s fair value using a two-stage valuation model based on discounted free cash flow or earnings.

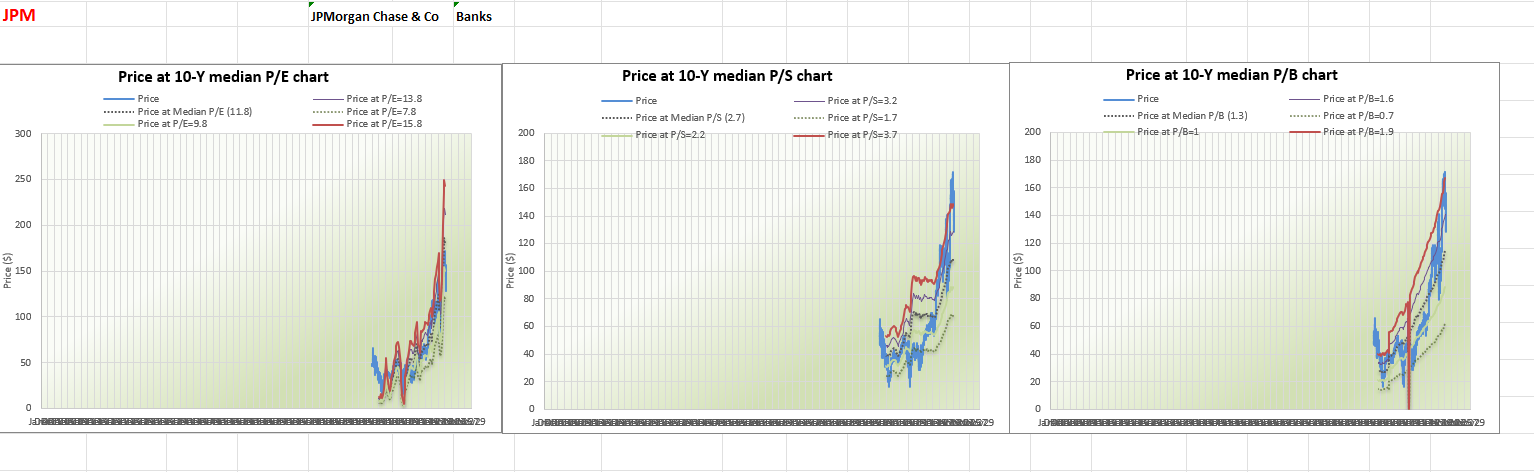
Peter Lynch Chart Template
View a stock’s price line compared to valuation bands based on earnings, book value and sales.
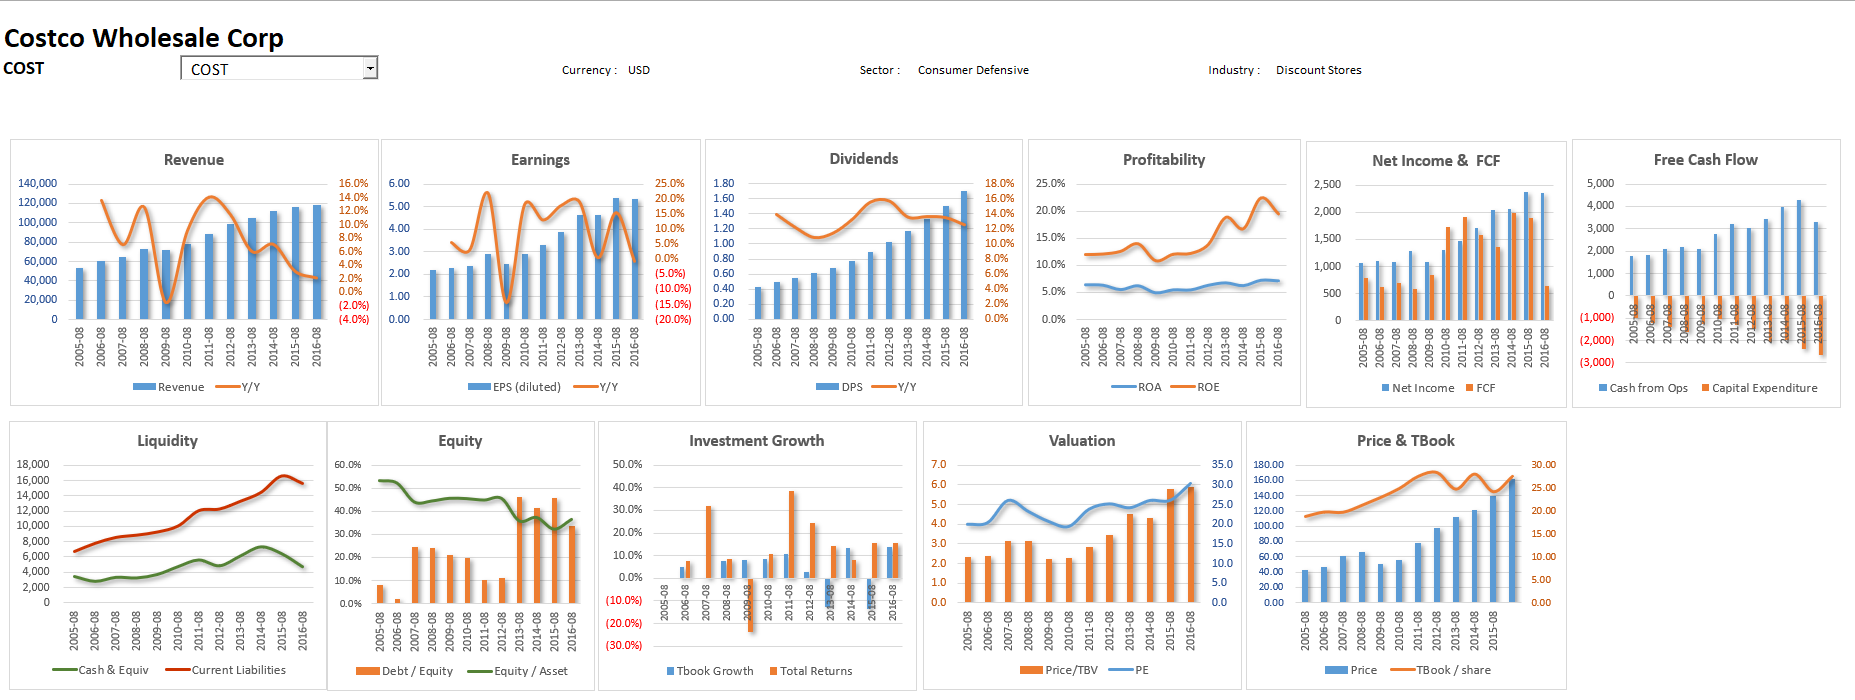
Historical Charts Template
Visualize a company’s fundamentals using a wide range of historical charts. The data includes earnings, free cash flow, equity and liquidity metrics.
Frequently Asked Questions
Which version of Excel is supported by GuruFocus Excel Add-in?
The new Excel Add-in currently supports Office 365 and one-time purchase versions of Office 2021 and later. It supports Office on Windows, macOS and webpage.
What are the advantages of using GuruFocus Excel Add-in?
- It is fully customizable.
- You can pull data directly from GuruFocus databases and research stocks without leaving Excel.
- One click refreshes all data.
- Plenty of functions and templates have been built in GuruFocus' Excel Add-in, and they make your research more efficient.
- You can save your work and easily come back later to check your research for buying and selling a stock.
Do I need a Premium Membership to take the advantage of GuruFocus Excel Add-in?
Premium Plus and Premium Members can use this application. Premium Members have a data download limit. The data and valuation template that is available to download depends on the regions the users subscribed to.
How do I uninstall GuruFocus Excel Add-in?
Select "Home" tab on Excel ribbon and click "Add-ins", then click "Get Add-ins" and switch to "MY ADD-INS" tab. Select "GuruFocus Add-in" and click Option menu on the top right, then select "Remove".
What's the limit of GURUF usage?
Premium users have 2,000 queries per month (for each region subscribed), while Premium Plus users have unlimited queries and free users do not have access to the Excel Add-In or Google Sheets Add-On. Paying users' usage will be reset on the first day of each month. Only 1,000 queries are allowed for users during the free trial period (not paying users).
How do you count queries?
Every call of formula will be counted as 1 query.
What if the add-in does not show up in the Excel ribbon? How do I fix it?
Select "Home" tab on Excel ribbon and click "Add-ins", then click "Get Add-ins" and switch to "MY ADD-INS" tab. Select "GuruFocus Add-in" and click "Add" button to reinstall the add-in.
What if the add-in does not work as expected, for example, the login button does not work? How do I fix it?
- From the ribbon of Excel, navigate to File > Options > Trust Center > Trust Center Settings > Trusted Add-in Catalogs.
- Select the checkbox Next time Office starts, clear all previously-started web add-ins cache.
- Restart Excel.
How to fix #NAME errors?
Clicking Reload Data button will fix most of #NAME? issues. If there are cell array keep displaying #NAME?, please click one cell of the array, then press CTRL + /, and then click the “Fix #NAME Array” button.
More questions?
Not sure exactly what we’re looking for or just want clarification? We’d be happy to chat with you and clear things up for you. Contact us anytime!
We'd love to learn more about your experiences on GuruFocus.com and how we can improve!
Take Survey