

With a daily gain of 3.15% and a 3-month loss of 14.65%, JB Hunt Transport Services Inc (JBHT, Financial) has been navigating through the volatile market with an Earnings Per Share (EPS) of 6.3. Investors are keen on understanding whether the stock reflects its true value. Is JB Hunt Transport Services fairly valued at its current market price? The following analysis will delve into the company's valuation to provide a clearer picture.
Company Overview
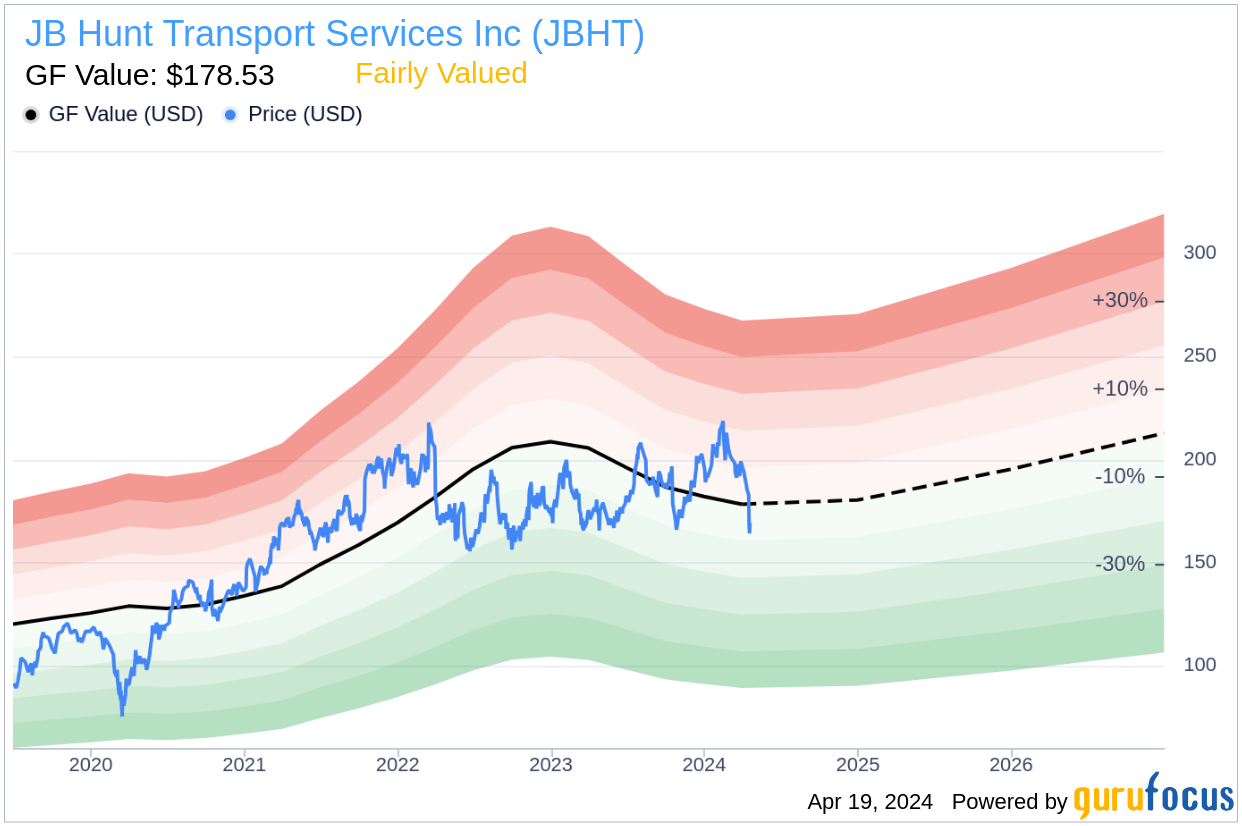
JB Hunt Transport Services, a leading entity in North America's surface transportation sector, boasts a diverse portfolio of services. With a market cap of $17.50 billion and a current stock price of $169.37, it is crucial to assess how this aligns with the company's GF Value, an estimated fair value of $178.53. This comparison sets the stage for an in-depth evaluation of JB Hunt Transport Services' intrinsic value, blending financial metrics with core business insights.

Understanding the GF Value
The GF Value is a unique measure of a stock's intrinsic value, incorporating historical trading multiples, a GuruFocus adjustment factor, and future business performance estimates. The GF Value Line suggests a fair trading price for the stock. If a stock's price significantly deviates from this line, it may indicate overvaluation or undervaluation, influencing its future returns. JB Hunt Transport Services (JBHT, Financial) appears to be fairly valued, with its stock price hovering near the GF Value Line, suggesting a potential alignment with its business growth rate.
Link: These companies may deliver higher future returns at reduced risk.
Financial Strength
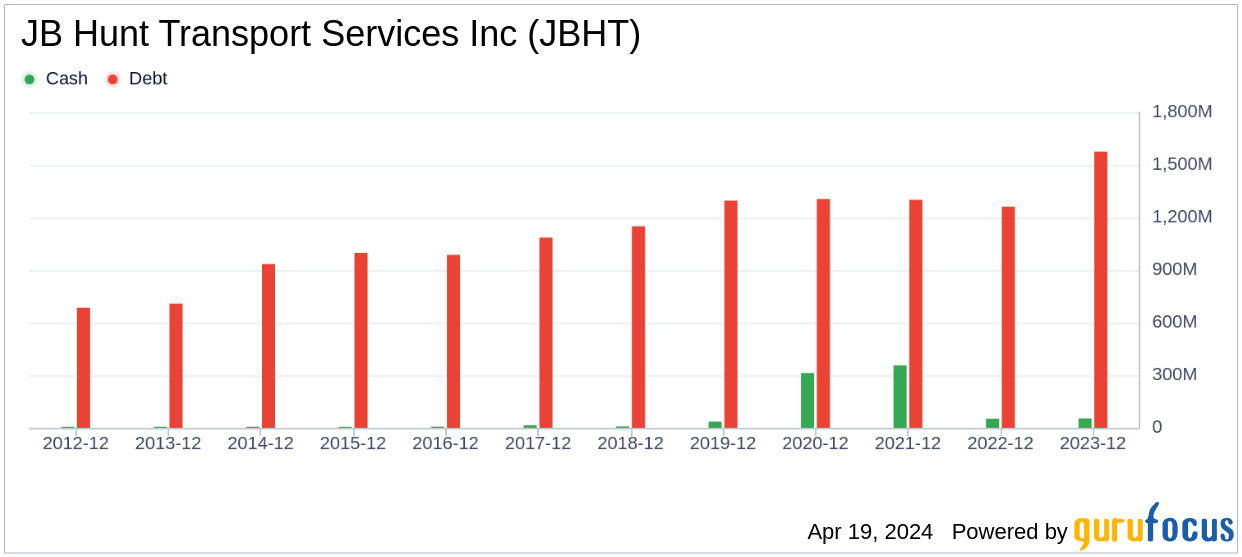
Before investing, assessing a company's financial strength is vital. JB Hunt Transport Services' cash-to-debt ratio of 0.05 is lower than 95.97% of peers in the Transportation industry, yet its overall financial strength is rated 7 out of 10, indicating a fair position. Below is a visual representation of the company's debt and cash over recent years.
Profitability and Growth
Profitability, especially consistent over time, is a less risky investment indicator. JB Hunt Transport Services has shown profitability for the past decade, with a solid operating margin of 7.26%, which surpasses 50.46% of its industry counterparts. The company's profitability is deemed strong by GuruFocus.
Growth is a critical valuation aspect, with GuruFocus research indicating its strong correlation with long-term stock performance. JB Hunt Transport Services' 3-year average annual revenue growth rate is 10.8%, ranking favorably within its industry. The company's 3-year average EBITDA growth rate is 12.7%, which also positions it well among peers.
Return on Invested Capital vs. Weighted Average Cost of Capital
Comparing Return on Invested Capital (ROIC) to the Weighted Average Cost of Capital (WACC) is another profitability indicator. ROIC exceeding WACC suggests value creation for shareholders. For JB Hunt Transport Services, the ROIC is 10.58, slightly below its WACC of 11.19, indicating a potential area for improvement. Below is the historical comparison of ROIC vs WACC for JB Hunt Transport Services.

Conclusion
In conclusion, JB Hunt Transport Services (JBHT, Financial) seems to be fairly valued. The company maintains fair financial health and exhibits strong profitability, with growth rates above industry averages. For a deeper dive into JB Hunt Transport Services' financials, you can explore its 30-Year Financials here.
To discover high-quality companies that may deliver above-average returns, check out GuruFocus High Quality Low Capex Screener.
This article, generated by GuruFocus, is designed to provide general insights and is not tailored financial advice. Our commentary is rooted in historical data and analyst projections, utilizing an impartial methodology, and is not intended to serve as specific investment guidance. It does not formulate a recommendation to purchase or divest any stock and does not consider individual investment objectives or financial circumstances. Our objective is to deliver long-term, fundamental data-driven analysis. Be aware that our analysis might not incorporate the most recent, price-sensitive company announcements or qualitative information. GuruFocus holds no position in the stocks mentioned herein.