

FedEx Corp (FDX, Financial) has recently shown a notable daily gain of 7.35% and an impressive three-month gain of 15.21%. With an Earnings Per Share (EPS) of $17.34, investors are keen to understand if the current stock performance aligns with the company's true value. Is FedEx (FDX) modestly overvalued as the market suggests? This analysis seeks to answer that question by delving into the company's valuation.
Company Introduction
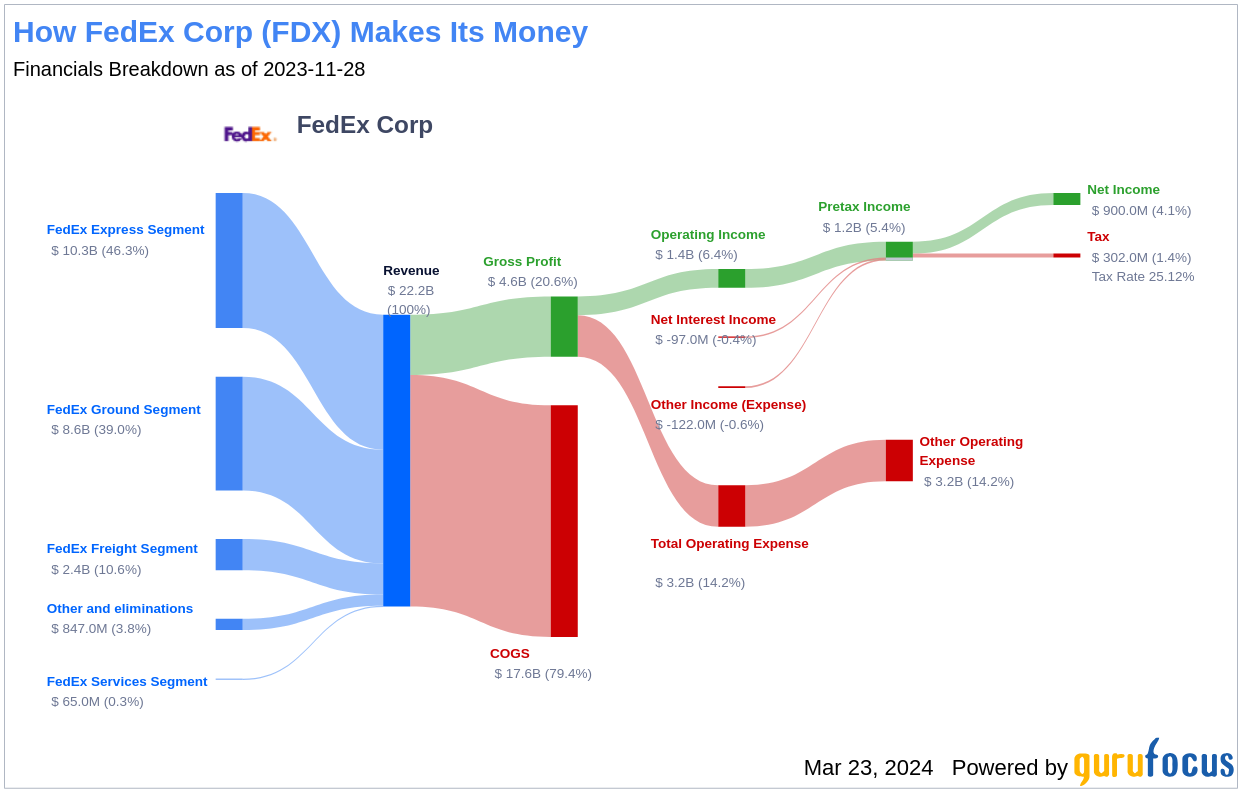
FedEx pioneered the overnight delivery service and has grown to become the world's largest express package provider. In fiscal 2023, FedEx derived a significant portion of its revenue from its express, ground, and freight divisions, with additional services contributing to its robust financial profile. The current stock price of $284.32 per share is juxtaposed against the GF Value of $246.86, suggesting a modest overvaluation. This introduction sets the stage for a deeper valuation analysis, incorporating financial metrics with the company's historical and current business operations.
Summarize GF Value
The GF Value is a proprietary measure that reflects the intrinsic value of a stock, based on historical trading multiples, a GuruFocus adjustment factor, and future business performance estimates. According to this measure, FedEx (FDX, Financial) appears modestly overvalued. The GF Value Line suggests that the stock price should ideally align with this fair value estimate. When the stock price significantly diverges from the GF Value Line—higher or lower—it signals potential overvaluation or undervaluation, respectively. Currently, FedEx's stock price exceeds our GF Value estimate, which could imply lower future returns compared to the company's business growth.

Link: These companies may deliver higher future returns at reduced risk.
Financial Strength
Before investing in a stock, assessing the company's financial strength is crucial. Companies with weak financials pose a higher risk of permanent loss. FedEx's cash-to-debt ratio of 0.18 is lower than that of the majority of its peers in the Transportation industry. This ratio, combined with an overall financial strength rating of 6 out of 10, indicates that FedEx's financial health is fair, but not without its risks.

Profitability and Growth
Investing in profitable companies, particularly those with a track record of consistent profitability, is generally less risky. FedEx has maintained profitability for the past decade, with a revenue of $87.50 billion and an Earnings Per Share (EPS) of $17.34 over the last twelve months. Its operating margin stands at 6.72%, which reflects its position within the Transportation industry. GuruFocus ranks FedEx's profitability at 9 out of 10, signifying strong profitability.
Growth is a pivotal factor in a company's valuation. FedEx's 3-year average revenue growth rate surpasses that of 59.02% of companies in the Transportation industry. Furthermore, its 3-year average EBITDA growth rate of 20.7% ranks better than 66.33% of companies in the same sector, indicating a healthy growth trajectory.
ROIC vs WACC
The comparison between a company's Return on Invested Capital (ROIC) and its Weighted Average Cost of Capital (WACC) can offer insight into its profitability. FedEx's ROIC of 6.15% is currently below its WACC of 8.01%, suggesting that the company may not be generating sufficient cash flow relative to the capital invested in the business.

Conclusion
In conclusion, FedEx Corp (FDX, Financial) appears modestly overvalued when considering the GF Value. The company's financial condition is fair, and its profitability is robust. Growth indicators place FedEx above many of its industry counterparts. For those interested in a more detailed financial overview of FedEx, the company's 30-Year Financials can be found here.
For investors seeking high-quality companies that may deliver above-average returns, the GuruFocus High Quality Low Capex Screener is an invaluable resource.
This article, generated by GuruFocus, is designed to provide general insights and is not tailored financial advice. Our commentary is rooted in historical data and analyst projections, utilizing an impartial methodology, and is not intended to serve as specific investment guidance. It does not formulate a recommendation to purchase or divest any stock and does not consider individual investment objectives or financial circumstances. Our objective is to deliver long-term, fundamental data-driven analysis. Be aware that our analysis might not incorporate the most recent, price-sensitive company announcements or qualitative information. GuruFocus holds no position in the stocks mentioned herein.