
Long-established in the Asset Management industry, Blackstone Inc (BX, Financial) has enjoyed a stellar reputation. It has recently witnessed a daily gain of 3.77%, juxtaposed with a three-month change of 3.28%. However, fresh insights from the GF Score hint at potential headwinds. Notably, its diminished rankings in financial strength, growth, and valuation suggest that the company might not live up to its historical performance. Join us as we dive deep into these pivotal metrics to unravel the evolving narrative of Blackstone Inc.
What Is the GF Score?
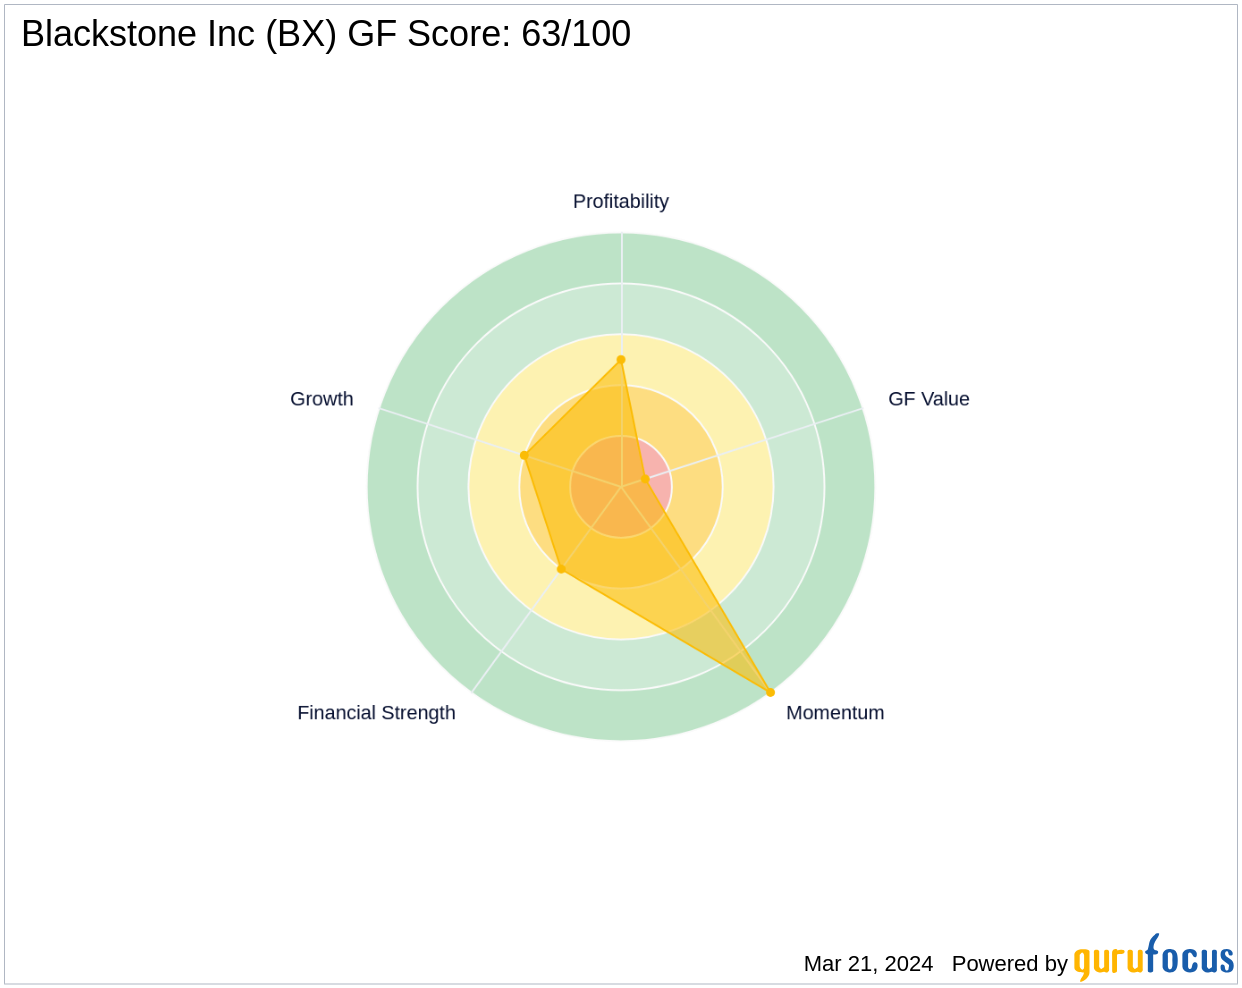
The GF Score is a stock performance ranking system developed by GuruFocus using five aspects of valuation, which has been found to be closely correlated to the long-term performances of stocks by backtesting from 2006 to 2021. The stocks with a higher GF Score generally generate higher returns than those with a lower GF Score. Therefore, when picking stocks, investors should invest in companies with high GF Scores. The GF Score ranges from 0 to 100, with 100 as the highest rank.
- Financial strength rank: 4/10
- Profitability rank: 5/10
- Growth rank: 4/10
- GF Value rank: 1/10
- Momentum rank: 10/10
Based on the above method, GuruFocus assigned Blackstone Inc the GF Score of 63 out of 100, which signals poor future outperformance potential.
Understanding Blackstone Inc's Business
Blackstone Inc, with a market cap of approximately $99.87 billion and sales of $7.01 billion, is the world's largest alternative-asset manager. As of the end of 2023, the company boasts $1.040 trillion in total assets under management, including $762.6 billion in fee-earning assets. Blackstone Inc operates across four core business segments: private equity, real estate, credit and insurance, and hedge fund solutions. With a global presence through 25 offices, the firm primarily serves institutional investors, accounting for 87% of AUM, while also catering to high-net-worth clients, making up the remaining 13%.

Financial Strength Breakdown
Blackstone Inc's financial strength indicators present some concerning insights about the company's balance sheet health. The company's low cash-to-debt ratio at 0.24 indicates a struggle in handling existing debt levels. Furthermore, the company's debt-to-Ebitda ratio is 9999, which is above Joel Tillinghast's warning level of 4 and is worse than 0% of 362 companies in the Asset Management industry. Tillinghast suggests that a high debt-to-Ebitda ratio can be a red flag unless tangible assets cover the debt.
Profitability Breakdown
Blackstone Inc's low Profitability rank can also raise warning signals. The company's Net Margin has declined over the past five years, with figures showing a decrease from 33.20% in 2019 to 19.85% in 2023. This downward trend in profitability is a concerning indicator for potential investors.
Growth Prospects
A lack of significant growth is another area where Blackstone Inc seems to falter, as evidenced by the company's low Growth rank. Additionally, Blackstone Inc's predictability rank is just one star out of five, adding to investor uncertainty regarding revenue and earnings consistency.

Next Steps
Considering Blackstone Inc's financial strength, profitability, and growth metrics, the GF Score highlights the firm's unparalleled position for potential underperformance. Investors should be cautious and consider these factors when evaluating the company's future prospects. For those seeking more robust investment opportunities, GuruFocus Premium members can find companies with strong GF Scores using the following screener link: GF Score Screen.
This article, generated by GuruFocus, is designed to provide general insights and is not tailored financial advice. Our commentary is rooted in historical data and analyst projections, utilizing an impartial methodology, and is not intended to serve as specific investment guidance. It does not formulate a recommendation to purchase or divest any stock and does not consider individual investment objectives or financial circumstances. Our objective is to deliver long-term, fundamental data-driven analysis. Be aware that our analysis might not incorporate the most recent, price-sensitive company announcements or qualitative information. GuruFocus holds no position in the stocks mentioned herein.