
Long-established in the Travel & Leisure industry, Wynn Resorts Ltd (WYNN, Financial) has enjoyed a stellar reputation. However, it has recently witnessed a daily loss of 1.62%, juxtaposed with a three-month change of 11.53%. Fresh insights from the GF Score hint at potential headwinds. Notably, its diminished rankings in financial strength, growth, and valuation suggest that the company might not live up to its historical performance. Join us as we dive deep into these pivotal metrics to unravel the evolving narrative of Wynn Resorts Ltd.
What Is the GF Score?
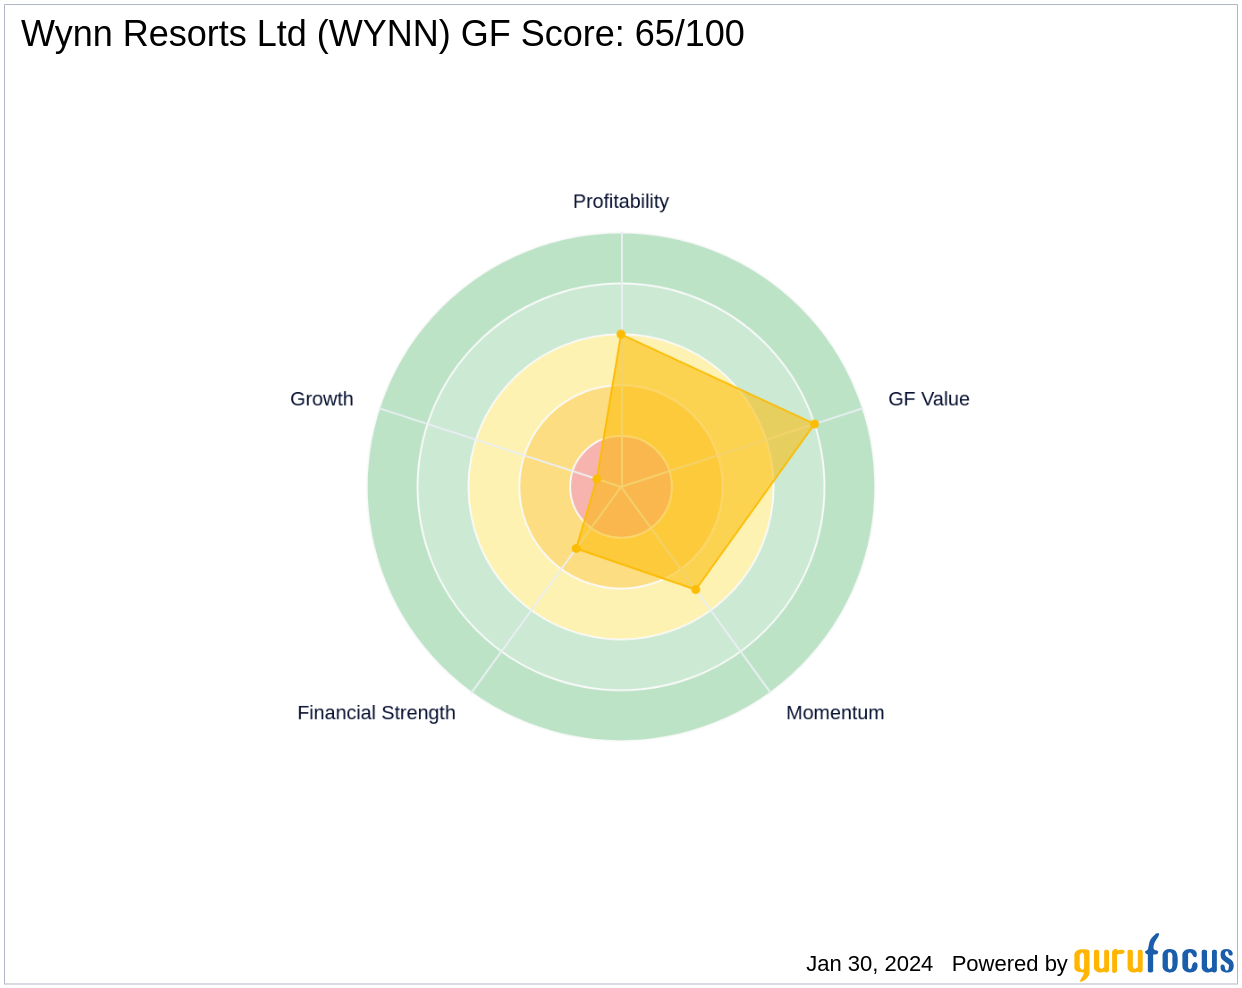
The GF Score is a stock performance ranking system developed by GuruFocus using five aspects of valuation, which has been found to be closely correlated to the long-term performances of stocks by backtesting from 2006 to 2021. The stocks with a higher GF Score generally generate higher returns than those with a lower GF Score. Therefore, when picking stocks, investors should invest in companies with high GF Scores. The GF Score ranges from 0 to 100, with 100 as the highest rank.
- Financial strength rank: 3/10
- Profitability rank: 6/10
- Growth rank: 1/10
- GF Value rank: 8/10
- Momentum rank: 5/10
Based on the above method, GuruFocus assigned Wynn Resorts Ltd the GF Score of 65 out of 100, which signals poor future outperformance potential.
Understanding Wynn Resorts Ltd's Business
Wynn Resorts Ltd, with a market cap of $10.78 billion and sales of $5.70 billion, operates luxury casinos and resorts. Founded in 2002 by Steve Wynn, the company boasts four megaresorts: Wynn Macau and Encore in Macao, and Wynn Las Vegas and Encore in Las Vegas. The Cotai Palace opened in August 2016 in Macao, and Encore Boston Harbor in Massachusetts opened in June 2019. A new building next to its existing Wynn Palace resort is expected around 2028. Wynn Resorts also runs Wynn Interactive, a digital sports betting and iGaming platform. In 2019, before the pandemic, the company derived 76% of its EBITDA from Macao and 24% from Las Vegas.

Financial Strength Breakdown
Wynn Resorts Ltd's financial strength indicators present some concerning insights about the company's balance sheet health. The interest coverage ratio of 0.91 positions it worse than 87.1% of 589 companies in the Travel & Leisure industry, indicating potential challenges in managing interest expenses on debt. The Altman Z-Score of just 0.98 falls below the distress zone threshold of 1.81, suggesting possible financial distress in the near future. Moreover, the low cash-to-debt ratio at 0.27 and a debt-to-Ebitda ratio of 9.5, which is above the warning level of 4, further underscore the company's debt management challenges.
Growth Prospects
A lack of significant growth is another area where Wynn Resorts Ltd seems to falter, as evidenced by the company's low Growth rank. The company's revenue has declined by an average of 18.8% per year over the past three years, underperforming 80.78% of 765 companies in the Travel & Leisure industry. This stagnation in revenues may raise concerns in a rapidly evolving market. Additionally, Wynn Resorts Ltd's predictability rank is just one star out of five, adding to investor uncertainty regarding revenue and earnings consistency.

Next Steps
Considering Wynn Resorts Ltd's financial strength, profitability, and growth metrics, the GF Score highlights the firm's unparalleled position for potential underperformance. Investors should be cautious and consider these factors when evaluating the company's future prospects. For those seeking more robust investment opportunities, GuruFocus Premium members can explore companies with strong GF Scores using the following screener link: GF Score Screen.
This article, generated by GuruFocus, is designed to provide general insights and is not tailored financial advice. Our commentary is rooted in historical data and analyst projections, utilizing an impartial methodology, and is not intended to serve as specific investment guidance. It does not formulate a recommendation to purchase or divest any stock and does not consider individual investment objectives or financial circumstances. Our objective is to deliver long-term, fundamental data-driven analysis. Be aware that our analysis might not incorporate the most recent, price-sensitive company announcements or qualitative information. GuruFocus holds no position in the stocks mentioned herein.