

Macy's Inc (M, Financial) recently showcased a notable daily gain of 19.44%, complemented by an impressive three-month gain of 83.66%. With an Earnings Per Share (EPS) of $2.46, investors are keen to understand whether the stock is fairly valued. This analysis delves into the valuation of Macy's, offering insights into whether the current stock price reflects the company's intrinsic value.
Company Introduction
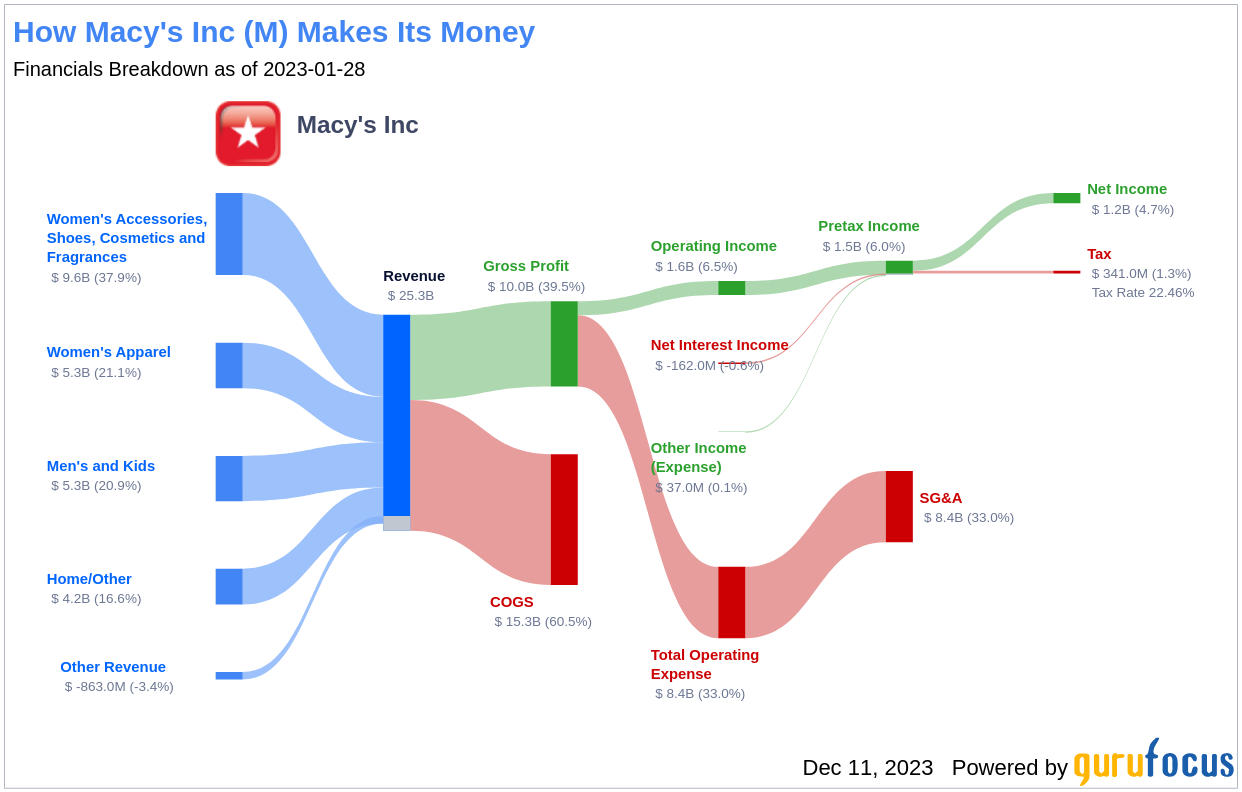
Macy's Inc (M, Financial), founded in 1858 and headquartered in New York City, is a retail giant with a storied history. Operating approximately 550 Macy's stores, nearly 60 Bloomingdale's locations, and 158 freestanding Bluemercury beauty stores, Macy's has a significant presence both in-store and online. Notably, women's apparel, accessories, shoes, cosmetics, and fragrances accounted for 61% of the company's 2022 sales. With a current stock price of $20.77 and a market cap of $5.70 billion, the question arises: how does this compare to Macy's GF Value, an estimation of its fair value?
Summarize GF Value
The GF Value is a unique measure of a stock's intrinsic value, incorporating historical trading multiples, a GuruFocus adjustment factor, and future business performance estimates. The GF Value Line provides a visual representation of the stock's fair trading value. If a stock trades significantly above this line, it may be overvalued, potentially leading to poor future returns. Conversely, trading below the line suggests a higher likelihood of better future returns.
For Macy's Inc (M, Financial), the GF Value suggests that the stock is fairly valued. The current price of $20.77 per share seems to align with the calculated fair value, indicating that the long-term return of Macy's stock should closely reflect the company's business growth rate.

Financial Strength
Investing in companies with robust financial strength is crucial to minimize the risk of permanent capital loss. Key indicators such as the cash-to-debt ratio and interest coverage provide insights into a company's financial resilience. Macy's cash-to-debt ratio stands at 0.06, ranking lower than 87.53% of peers in the Retail - Cyclical industry. With an overall financial strength rating of 5 out of 10, Macy's financial position is considered fair.
Profitability and Growth
Profitability is a vital factor for a safe investment, especially for companies with a track record of consistent profitability. Macy's has turned a profit for 9 of the past 10 years, with a revenue of $23.90 billion and an Earnings Per Share (EPS) of $2.46 over the past twelve months. Its operating margin of 4.16% ranks in the top half of its industry. The company's profitability score is a solid 7 out of 10.
Regarding growth, Macy's 3-year average annual revenue growth rate is 3.4%, while its EBITDA growth rate is 13.8%, indicating that the company is creating value for shareholders and performing well in its sector.
ROIC vs WACC
Comparing a company's Return on Invested Capital (ROIC) to its Weighted Average Cost of Capital (WACC) provides another perspective on profitability. Macy's ROIC of 6.71 and WACC of 6.74 suggest that the company is just about creating value for its shareholders.
Conclusion
In conclusion, Macy's Inc (M, Financial) appears to be fairly valued at its current stock price. The company maintains a fair financial condition and profitability, with growth rates that are competitive within the Retail - Cyclical industry. For a deeper understanding of Macy's financial health and potential, investors are encouraged to review the 30-Year Financials here.
To discover high-quality companies that may deliver above-average returns, please visit the GuruFocus High Quality Low Capex Screener.
This article, generated by GuruFocus, is designed to provide general insights and is not tailored financial advice. Our commentary is rooted in historical data and analyst projections, utilizing an impartial methodology, and is not intended to serve as specific investment guidance. It does not formulate a recommendation to purchase or divest any stock and does not consider individual investment objectives or financial circumstances. Our objective is to deliver long-term, fundamental data-driven analysis. Be aware that our analysis might not incorporate the most recent, price-sensitive company announcements or qualitative information. GuruFocus holds no position in the stocks mentioned herein.