

With a notable daily gain of 15.44% and a 3-month gain of 4.34%, American Woodmark Corp (AMWD, Financial) has caught the attention of investors. This performance, coupled with an Earnings Per Share (EPS) of 6.69, raises the question: Is the stock modestly overvalued? To provide an answer, we delve into a valuation analysis that considers various financial metrics and intrinsic value measures. Continue reading for an insightful exploration of American Woodmark's valuation.
Company Introduction
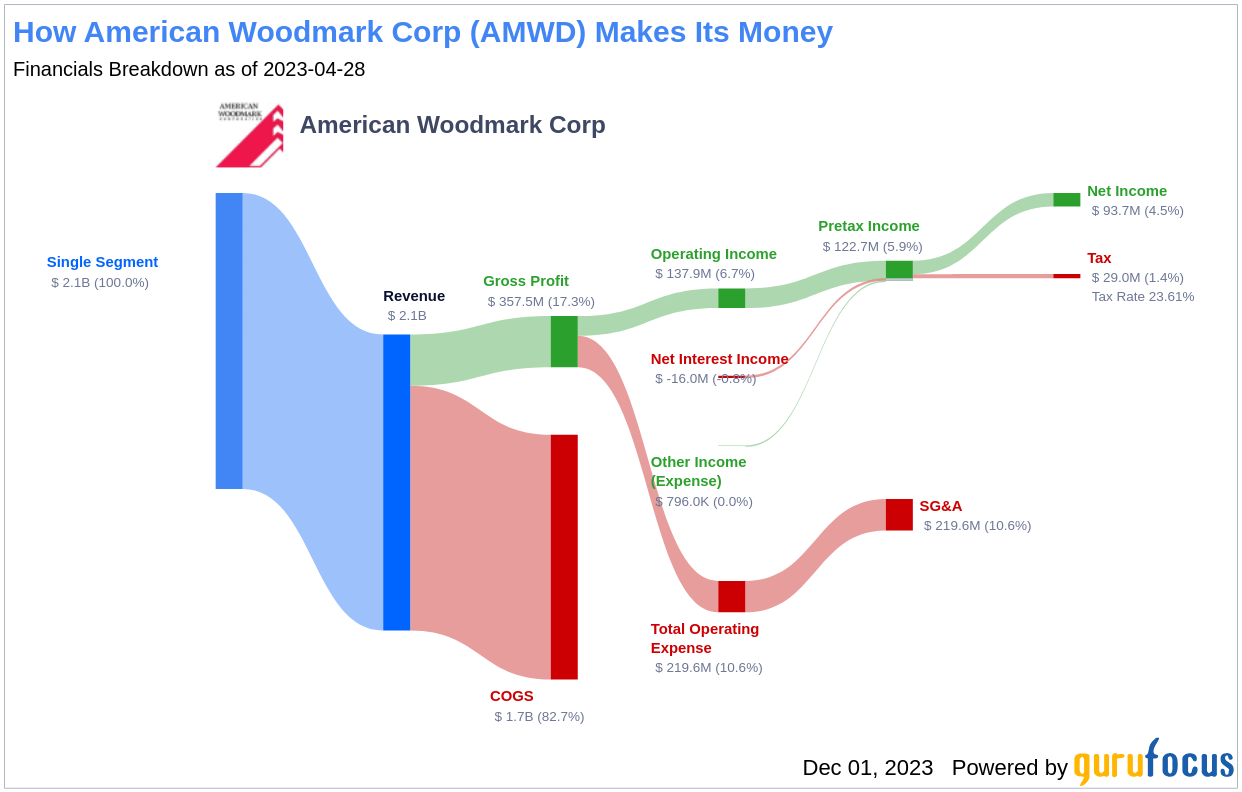
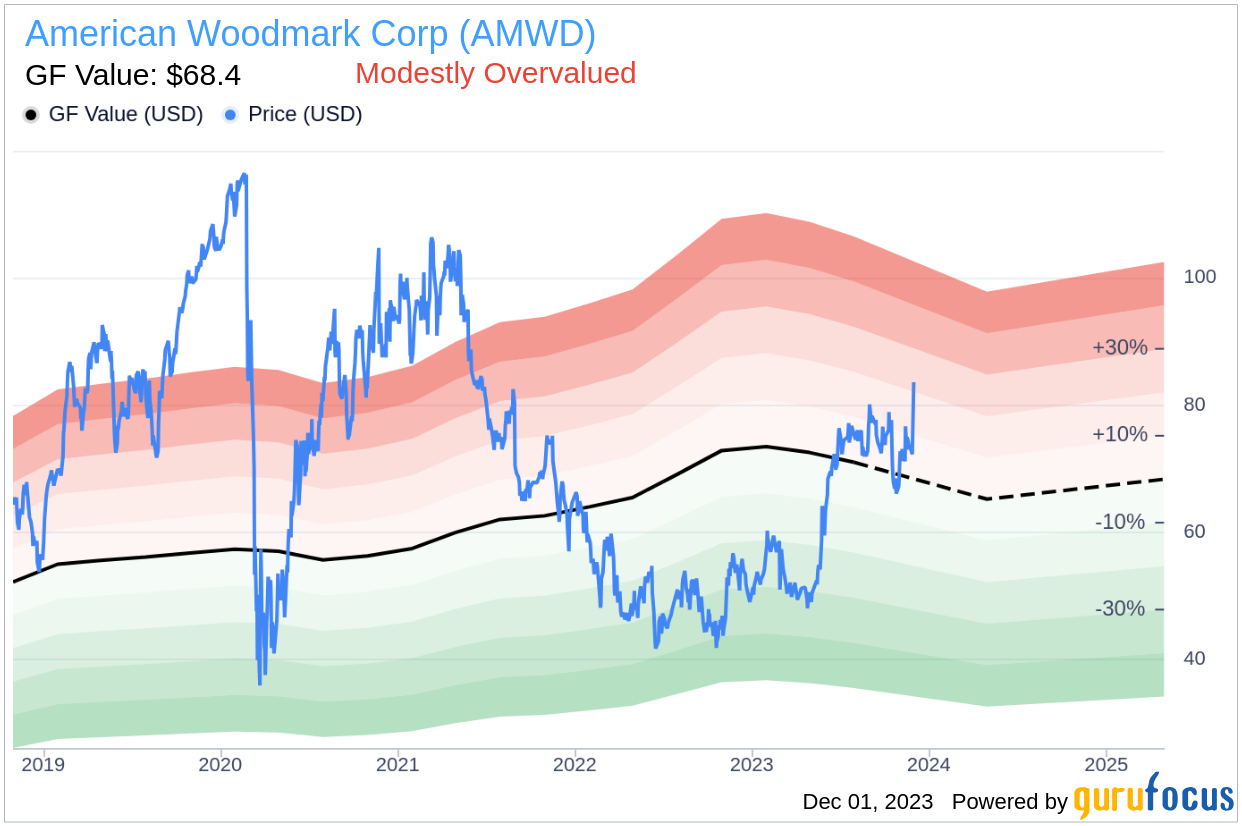
American Woodmark Corp (AMWD, Financial) is a prominent manufacturer and distributor of kitchen cabinets and vanities for the remodeling and new home construction markets. With a diverse product line available under several brand names, the company has established a strong national presence across the United States. Currently, American Woodmark's stock price stands at $83.58, with a market cap of $1.40 billion. When compared to the GF Value, an estimation of the stock's fair value, we begin to see a picture of the company's valuation landscape. Below is an income breakdown that provides further insight into American Woodmark's financial performance.
Summarize GF Value
The GF Value is a unique metric that represents a stock's intrinsic value, calculated using historical trading multiples, a GuruFocus adjustment factor based on past performance and growth, and future business performance estimates. This value serves as a benchmark for what the stock should ideally trade at. American Woodmark's current stock price suggests that it is modestly overvalued according to the GF Value Line. This valuation implies that the long-term return of American Woodmark's stock may be less than the company's business growth potential.
Link: These companies may deliver higher future returns at reduced risk.
Financial Strength
Investing in companies with robust financial strength is crucial to minimize the risk of permanent loss of capital. A key indicator of financial health is the cash-to-debt ratio. American Woodmark's ratio of 0.19 is lower than the majority of its industry peers. Despite this, the company's overall financial strength has been rated a fair 7 out of 10 by GuruFocus. This assessment suggests that American Woodmark maintains a reasonable level of financial stability.
Profitability and Growth
Profitability is a less risky proposition when it comes to investment. American Woodmark has demonstrated consistent profitability over the last decade, with a commendable operating margin of 7.75%, ranking it favorably within its industry. The company's profitability score is a solid 7 out of 10.
When it comes to growth, American Woodmark's average annual revenue growth is 8.4%, which is competitive within its sector. However, its 3-year average EBITDA growth rate is lower than 60% of comparable companies, indicating mixed performance in this area.
ROIC vs WACC
An effective way to gauge profitability is by comparing the Return on Invested Capital (ROIC) against the Weighted Average Cost of Capital (WACC). Ideally, ROIC should exceed WACC to indicate efficient cash flow generation relative to capital investment. For the past 12 months, American Woodmark's ROIC is slightly below its WACC, which could suggest less optimal capital efficiency.
Conclusion
In conclusion, American Woodmark (AMWD, Financial) appears to be modestly overvalued based on the current assessment. The company's financial condition and profitability are deemed fair, but its growth shows potential for improvement. For those looking to make an informed decision on investing in American Woodmark, a deeper dive into the company's 30-Year Financials is recommended.
To discover high-quality companies that may offer above-average returns, consider exploring the GuruFocus High Quality Low Capex Screener.
This article, generated by GuruFocus, is designed to provide general insights and is not tailored financial advice. Our commentary is rooted in historical data and analyst projections, utilizing an impartial methodology, and is not intended to serve as specific investment guidance. It does not formulate a recommendation to purchase or divest any stock and does not consider individual investment objectives or financial circumstances. Our objective is to deliver long-term, fundamental data-driven analysis. Be aware that our analysis might not incorporate the most recent, price-sensitive company announcements or qualitative information. GuruFocus holds no position in the stocks mentioned herein.