
Dynacor Group Inc. (TSX: DNG) (Dynacor or the Corporation) released its unaudited condensed interim consolidated financial statements and the management's discussion and analysis (MD&A) for the third quarter ended September 30, 2023.
This press release features multimedia. View the full release here: https://www.businesswire.com/news/home/20231113578607/en/
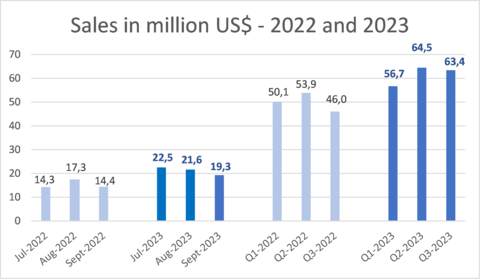
Sales in million US$ - 2022 and 2023 (Graphic: Business Wire)
These documents have been filed electronically with SEDAR at www.sedar.com and will be available on the Corporation's website www.dynacor.com.
(All figures in this press release are in Ms of US$ unless stated otherwise. All amounts per share are in US$. All variance % are calculated from rounded figures. Some additions might be incorrect due to rounding).
Q3-2023 OVERVIEW AND HIGHLIGHTS
OVERVIEW
Dynacor completed the three-month period ended September 30, 2023 (“Q3-2023”) with a record production of 34,103 AuEq ounces, quarterly sales increase of 37.8% at $63.4 million and a net income increase of 212.5% at $2.5 million (US$0.07 per share) compared to sales of $46.0 million and a net income of $0.8 million (US$0.02 per share) for the third quarter of 2022 (“Q3-2022”).
At the end of 2022 the plant capacity was increased by 16% to 500 tpd. With the high level of ore supplied, Dynacor was able to both operate the plant at its full capacity all over 2023 and to increase the level of ore inventory to 10,200 tonnes at the end of Q3-2023. This inventory level represents more than 20 days of production.
The Q3-2023 production of 34,103 AuEq ounces is the third consecutive quarter-to-quarter increase in gold production.
Although the Q3-2023 gold market price was higher than Q3-2022, financial results were both affected by the declining trend in the gold market price.
HIGHLIGHTS
Operational
High ore volume supplied. Total ore volume supplied reached 45,244 tonnes in Q3-2023, the second-best quarter ever, compared to 41,646 tonnes for the same period of last year a 8.6% increase;
Record high volume processed. The Veta Dorada plant processed a volume of 44,519 tonnes of ore (484 tpd average) compared to 37,410 tonnes in Q3-2022 (407 tpd), a 19.0% increase;
Highest gold production. In Q3-2023, gold equivalent production amounted to 34,103 AuEq ounces compared to 27,252 AuEq ounces in Q3-2022 a 25.1% increase.
Financial
Full 500 tpd processed capacity accounted for the solid Q3-2023 financial operating performance.
Solid cash position. Cash on hand of $33.0 million at the end of Q3-2023 compared to $25.6 million at year end 2022;
Increase of 37.8% in Sales. With greater quantities and a higher average gold market price, sales amounted to $63.4 million in Q3-2023 compared to $46.0 million in Q3-2022;
Increase in gross operating margin. Gross operating margin of $7.0 million (11.0% of sales) in Q3-2023, compared to $4.5 million (9.8% of sales) in Q3-2022;
Increased operating income. Operating income of $5.1 million in Q3-2023 compared to $3.2 million in Q3-2022, a 59.4% increase;
Net income increase of 212.5%. Dynacor recorded a net income of $2.5 million in Q3-2023 (US$0.07 or CA$0.09 per share) compared to $0.8 million (US$0.02 or CA$0.03 per share) in Q3-2022;
Increased cash gross operating. Cash gross operating margin of $235 per AuEq ounce sold (1) compared to $197 in Q3-2022;
Increased EBITDA. EBITDA (2) of $5.8 million, compared to $3.8 million in Q3-2022, a 52.6% increase;
Strong cash flows. Cash flows from operating activities before change in working capital items of $3.9 million ($0.10 per share) (3) compared to $2.0 million ($0.05 per share) in Q3-2022.
Return to Shareholders
Share buy-back. 137,700 common shares repurchased for $0.3 million (CA$0.4 million) in Q3-2023, compared to 213,655 common shares for $0.5 million (CA$0.6 million) in Q3-2022;
Dividends. A $0.01 CA per share monthly dividend paid during the quarter. On an annual basis, the 2023 dividend will represent CA$0.12 per share or 3.6% dividend yield based on the current share price.
(1) Cash gross operating margin per AuEq ounce is in US$ and is calculated by subtracting the average cash cost of sale per equivalent ounces of Au from the average selling price per equivalent ounces of Au and is a non-IFRS financial performance measure with no standard definition under IFRS. It is therefore possible that this measure could not be comparable with a similar measure of another company.
(2) EBITDA: “Earnings before interest, taxes and depreciation” is a non-IFRS financial performance measure with no standard definition under IFRS. It is therefore possible that this measure could not be comparable with a similar measure of another corporation. The Corporation uses this non-IFRS measure as an indicator of the cash generated by the operations and allows investor to compare the profitability of the Corporation with others by canceling effects of different assets basis, effects due to different tax structures as well as the effects of different capital structures.
(3) Cash-flow per share is a non-IFRS financial performance measure with no standard definition under IFRS. It is therefore possible that this measure could not be comparable with a similar measure of another corporation. The Corporation uses this non-IFRS measure which can also be helpful to investors as it provides a result which can be compared with the Corporation market share price.
RESULTS FROM OPERATIONS
Unaudited Consolidated Statement of net income and comprehensive income
|
| |||||
|
|
|
|
| ||
|
|
|
|
| ||
|
|
|
|
| ||
|
|
|
|
| ||
|
|
|
|
| ||
|
|
|
|
| ||
|
|
|
|
| ||
|
|
|
|
| ||
|
|
|
|
| ||
|
|
|
|
| ||
|
|
|
|
| ||
|
|
|
|
| ||
|
|
|
|
| ||
| ||||||
|
|
|
|
| ||
|
|
|
|
| ||
Total sales amounted to $63.4 million compared to $46.0 million in Q3-2022. The $17.4 million increase is explained by higher quantities of gold ounces sold (+23.7% or +$10.9 million) and a higher average gold price (+$6.5 million).
Cumulative sales increased by $34.6 million compared to last year with higher quantities of gold ounces sold (+$25.0 million) and a higher average gold price (+$9.6 million). Since the 16% increase capacity in Q4-2022, the Chala plant has been running at its maximum 500 tpd throughput.
The Q3-2023 gross operating margin amounted to $7.0 million (11.0% of sales) compared to $4.5 million (9.8% of sales) in Q3-2022 and were both affected by the unfavorable trend in gold market prices during the periods.
General and administrative expenses amounted to $1.6 million compared to $1.2 million in Q3-2022. The increase is mainly due to employee related expenses (increase in headcounts, salaries, profit sharing and share based remunerations). Quarter-to-quarter expenses decreased however by $0.2 million.
The Q3-2023 net income includes a $2.7 million income tax expense including a $0.3 million (non-cash) deferred income tax expense ($2.3 million including a $0.3 million deferred tax expense in Q3-2022). The tax expense is also affected by the variance throughout the period of the Peruvian Sol against the US$. Future fluctuations will affect positively or negatively the deferred tax at the end of each period.
Reconciliation of non-IFRS measures
|
|
| ||||
|
|
|
| |||
| ||||||
|
|
|
|
| ||
|
|
|
|
| ||
|
|
|
|
| ||
|
|
|
|
| ||
|
|
|
|
| ||
CONSOLIDATED CASH FLOW FROM OPERATING, INVESTING AND FINANCING ACTIVITIES AND WORKING CAPITAL AND LIQUIDITY
Operating activities
During Q3-2023, the cash flow from operations, before changes in working capital items, amounted to $3.9 million ($14.2 million for the nine-month period ending September 30, 2023), compared to $2.0 million in Q3-2022 ($10.6 million for the nine-month period ending September 30, 2022).
During Q3-2023, total cash from operating activities amounted to $5.0 million ($16.2 million for the nine-month period ending September 30, 2023) compared to -$0.05 million in Q3-2022 ($9.5 million for the nine-month period ending September 30, 2022). Changes in working capital items amounted to $1.1 million ($2.0 million for the nine-month period ending September 30, 2023) compared to -$2.0 million in Q3-2022 (-$1.1 million for the nine-month period ending September 30, 2022). The variances are mainly attributable to the increase in inventories.
Investing activities
During the three-month period ended September 30, 2023, the Corporation invested $0.9 million (cumulative nine-month 2023 of $5.7 million). These amounts mainly include the purchase of an office in Lima, investments at the plant and new vehicles. All investments have been financed with internally generated cash-flows.
Financing activities
In Q3-2023, monthly dividends totaling CA$0.03 per share were disbursed for a total consideration of $0.9 million (CA$1.2 million) (cumulative nine-month of CA$0.09). In Q3-2022, monthly dividends totaling CA$0.025 per share were disbursed for a total consideration of $0.7 million (CA$1.0 million). Increases in monthly dividend were disbursed from January 2022 and then from January 2023.
In Q3-2023, 137,700 common shares were repurchased under the Corporation normal course issuer bid share buyback program for a total cash consideration of $0.3 million (CA$0.4 million) (cumulative nine-month of 207,080 shares) (213,655 shares for a total cash consideration of $0.5 million (CA$0.6 million) in Q3-2022).
Working capital and liquidity
As at September 30, 2023, the Corporation’s working capital increased to $50.3 million, including $33.0 million in cash ($43.7 million, including $25.6 million in cash at December 31, 2022).
CONSOLIDATED STATEMENT OF FINANCIAL POSITION
As at September 30, 2023, total assets amounted to $106.6 million ($96.9 million as at December 31, 2022). Major variances since last year-end come from the significant increase in cash and property plant and equipment.
|
|
| |
|
| ||
|
|
| |
|
|
| |
|
|
| |
|
|
| |
|
|
| |
|
|
| |
|
|
| |
|
|
| |
|
|
| |
|
|
| |
|
|
| |
|
|
| |
|
|
| |
|
|
| |
|
|
| |
|
|
| |
|
|
|
FOLLOW-UP OUTLOOK 2023
Ore processing
For 2023, the Corporation forecasted sales (1) in the range of $210-235 million representing a growth of 6.5-20.0% over 2022 sales. This would result in a net income in the range of $8.5-11.5 million ($0.22-0.30 per share) (CA$0.30-0.41 per share). At the current rate, total 2023 sales should reach $245 million, a 4.3% increase compared to the high range yearly projection and the net income will surpass the yearly projections.
(1) Using a market gold price ranging between $1,800 and $1,900 per ounce
Capex
The board of directors approved a capital budget up to $10.0 million which includes investments at the Veta Dorada plant for new efficiency improvement equipment’s, an increasing tailing pound capacity, additional vehicles for our ore purchase team and administrative and ore purchasing buildings. Depending on certain circumstances, management believes 2023 investments should reach $7.0 million.
Other project expenses
The Corporation has also budgeted approximately $1.0 million to advance other projects in other jurisdictions and has spent $0.6 million so far in 2023.
ABOUT DYNACOR
Dynacor is a dividend-paying industrial gold ore processor headquartered in Montreal, Canada. The corporation is engaged in gold production through the processing of ore purchased from the ASM (artisanal and small-scale mining) industry. At present, Dynacor operates in Peru, where its management and processing teams have decades of experience working with ASM miners. It also owns a gold exploration property (Tumipampa) in the Apurimac department.
The corporation intends to expand its processing operations in other jurisdictions as well.
Dynacor produces environmental and socially responsible gold through its PX IMPACT® gold program. A growing number of supportive firms from the fine luxury jewelry, watchmakers and investment sectors pay a small premium to our customer and strategic partner for this PX IMPACT® gold. The premium provides direct investment to develop health and education projects for our artisanal and small-scale miner’s communities.
Dynacor is listed on the Toronto Stock Exchange (DNG).
FORWARD-LOOKING INFORMATION
Certain statements in the preceding may constitute forward-looking statements, which involve known and unknown risks, uncertainties and other factors that may cause the actual results, performance, or achievements of Dynacor, or industry results, to be materially different from any future result, performance or achievement expressed or implied by such forward-looking statements. These statements reflect management’s current expectations regarding future events and operating performance as of the date of this news release.
Shares Outstanding: 38,191,548
Website: [url="]http://www.dynacor.com [/url]
Twitter: http://twitter.com/DynacorGold