

Marathon Oil Corp (MRO, Financial) has experienced a daily loss of -4.06%, and a 3-month loss of -1.57%. Despite these losses, the company's Earnings Per Share (EPS) (EPS) stands at 2.7. This raises an important question: is the stock modestly undervalued? In this article, we will delve into the valuation analysis of Marathon Oil, providing you with comprehensive insights. Stay with us as we unravel the true worth of this stock.
Understanding Marathon Oil Corp (MRO, Financial)
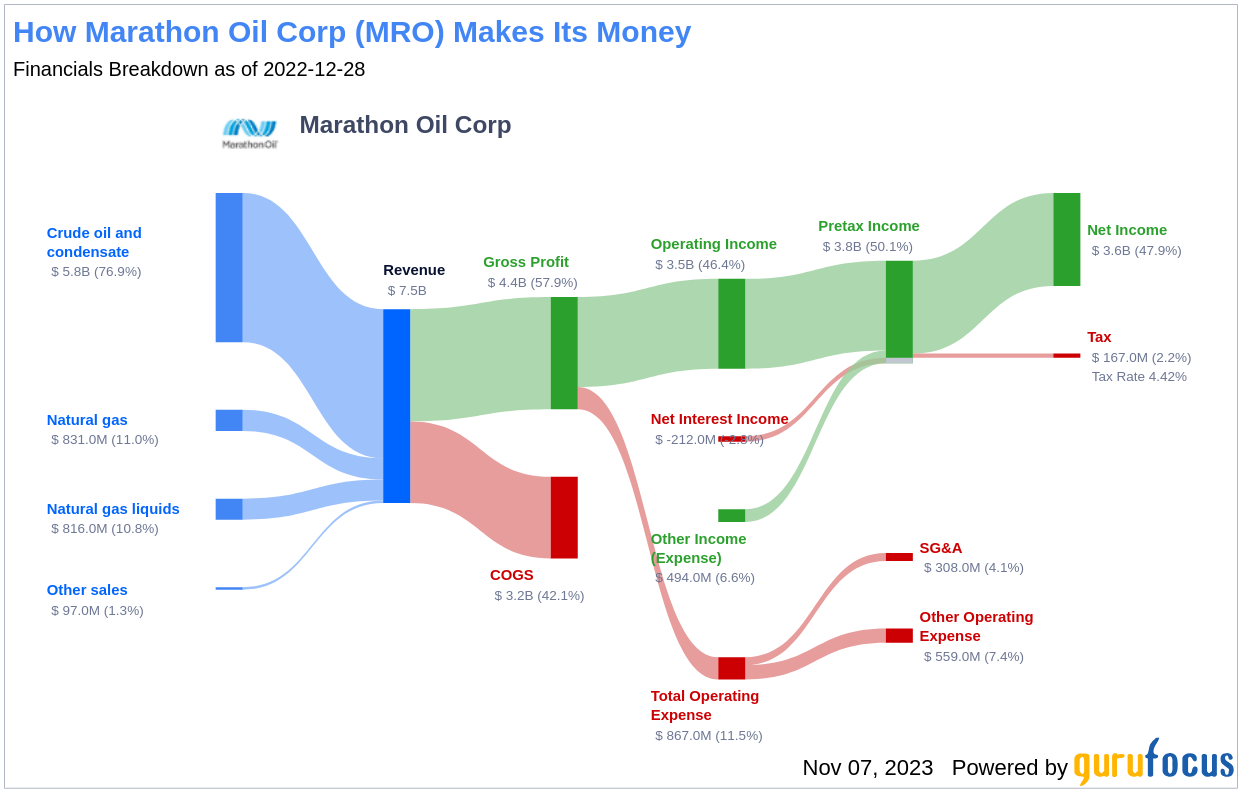
Marathon Oil is an independent exploration and production company primarily focusing on unconventional resources in the United States. As of the end of 2022, the company reported net proved reserves of 1.3 billion barrels of oil equivalent. Net production averaged 343 thousand barrels of oil equivalent per day in 2022 at a ratio of 70% oil and NGLs and 30% natural gas.
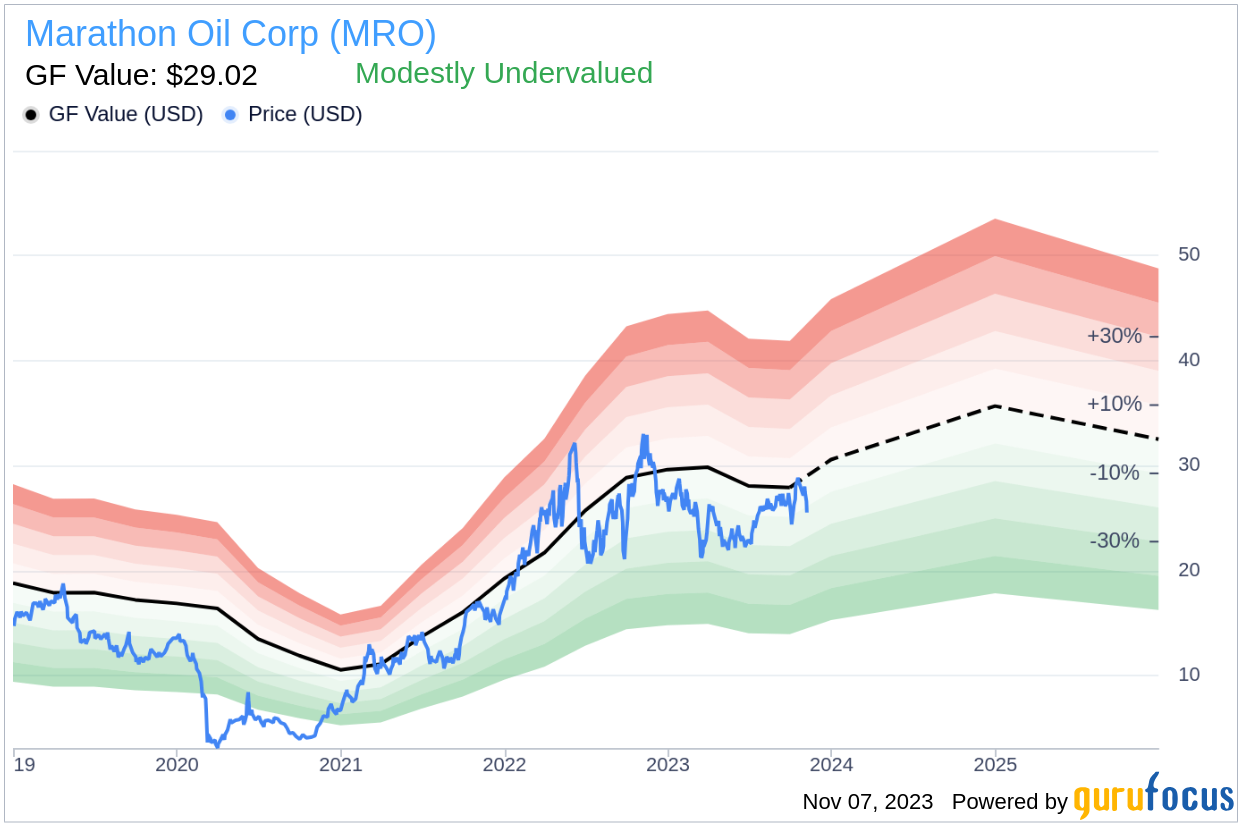
Marathon Oil's stock price stands at $25.53, while the GF Value, an estimation of its fair value, is $29.02. This comparison sets the stage for a deeper exploration of the company's value, ingeniously integrating financial assessment with essential company details.
Deciphering the GF Value
The GF Value represents the current intrinsic value of a stock derived from our exclusive method. The GF Value Line on our summary page gives an overview of the fair value that the stock should be traded at. It is calculated based on three factors:
- Historical multiples (PE Ratio, PS Ratio, PB Ratio and Price-to-Free-Cash-Flow) that the stock has traded at.
- GuruFocus adjustment factor based on the company's past returns and growth.
- Future estimates of the business performance.
At its current price of $25.53 per share, Marathon Oil has a market cap of $14.90 billion and the stock appears to be modestly undervalued. Because Marathon Oil is relatively undervalued, the long-term return of its stock is likely to be higher than its business growth.
Link: These companies may deliever higher future returns at reduced risk.
Assessing Marathon Oil's Financial Strength
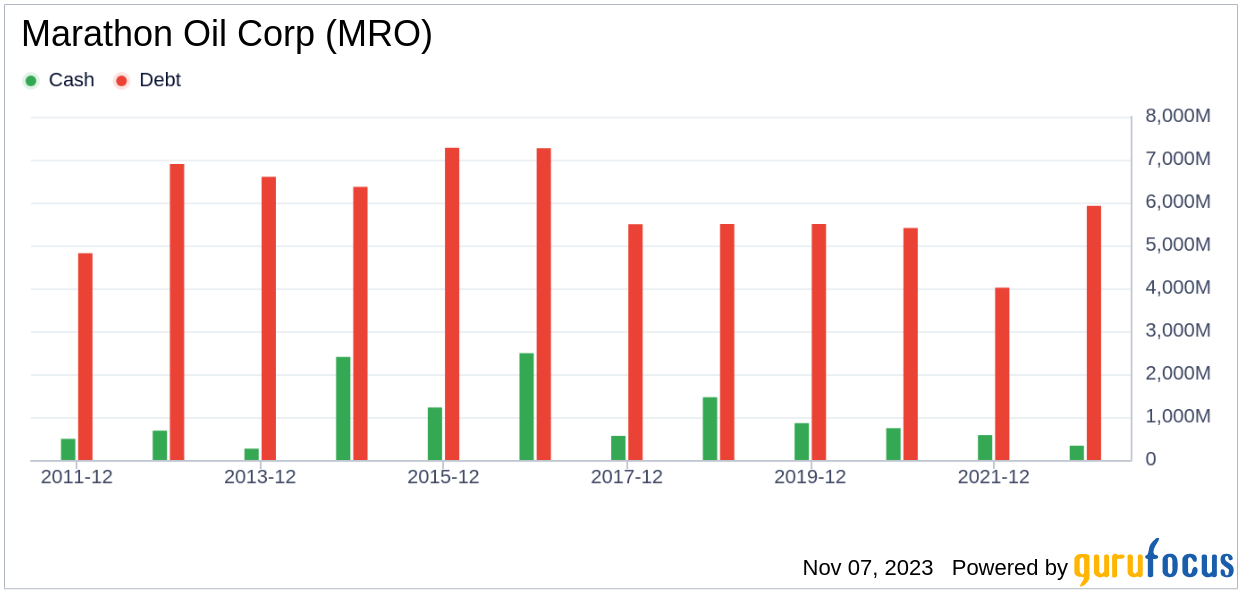
Investing in companies with poor financial strength have a higher risk of permanent loss. Looking at the cash-to-debt ratio and interest coverage is a great way to understand the financial strength of a company. Marathon Oil has a cash-to-debt ratio of 0.03, which is worse than 90.15% of 1036 companies in the Oil & Gas industry. The overall financial strength of Marathon Oil is 5 out of 10, which indicates that the financial strength of Marathon Oil is fair.
Profitability and Growth of Marathon Oil
Companies that have been consistently profitable over the long term offer less risk for investors who may want to purchase shares. Higher profit margins usually dictate a better investment compared to a company with lower profit margins. Marathon Oil has been profitable 6 over the past 10 years. Over the past twelve months, the company had a revenue of $6.40 billion and Earnings Per Share (EPS) of $2.7. Its operating margin is 34.15%, which ranks better than 79.74% of 987 companies in the Oil & Gas industry. Overall, the profitability of Marathon Oil is ranked 6 out of 10, which indicates fair profitability.
Growth is probably one of the most important factors in the valuation of a company. GuruFocus' research has found that growth is closely correlated with the long-term performance of a company's stock. If a company's business is growing, the company usually creates value for its shareholders, especially if the growth is profitable. Likewise, if a company's revenue and earnings are declining, the value of the company will decrease. Marathon Oil's 3-year average revenue growth rate is better than 71.1% of 865 companies in the Oil & Gas industry. Marathon Oil's 3-year average EBITDA growth rate is 30.3%, which ranks better than 68.03% of 829 companies in the Oil & Gas industry.
ROIC vs WACC
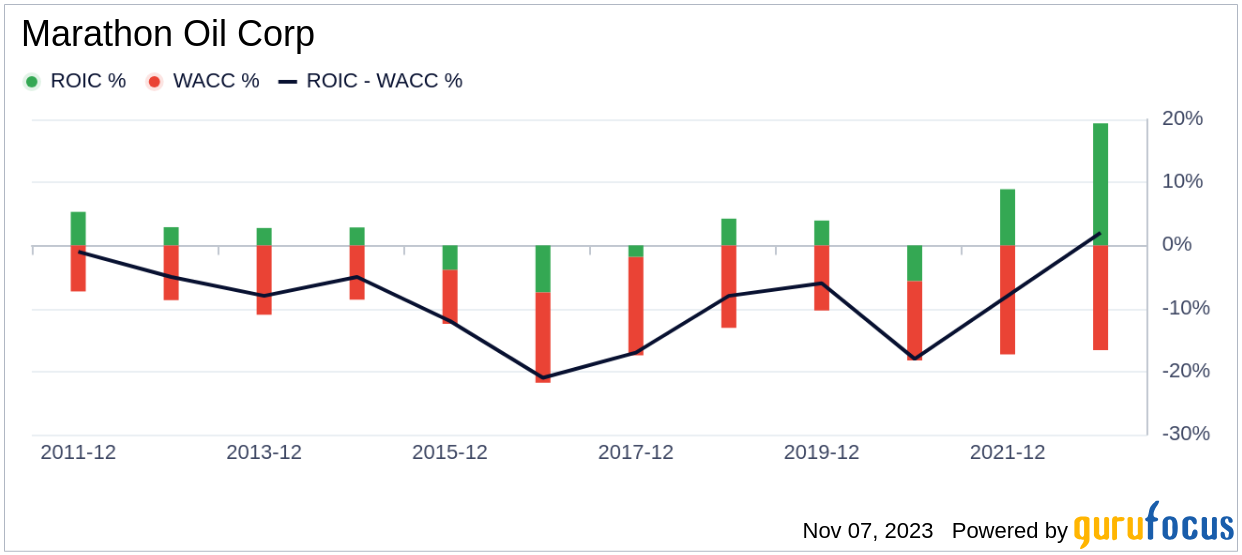
Return on invested capital (ROIC) measures how well a company generates cash flow relative to the capital it has invested in its business. The weighted average cost of capital (WACC) is the rate that a company is expected to pay on average to all its security holders to finance its assets. We want to have the return on invested capital higher than the weighted cost of capital. For the past 12 months, Marathon Oil's return on invested capital is 9.31, and its cost of capital is 11.31.
Conclusion
In summary, the stock of Marathon Oil (MRO, Financial) appears to be modestly undervalued. The company's financial condition is fair and its profitability is fair. Its growth ranks better than 68.03% of 829 companies in the Oil & Gas industry. To learn more about Marathon Oil stock, you can check out its 30-Year Financials here.
To find out the high quality companies that may deliver above-average returns, please check out GuruFocus High Quality Low Capex Screener.
This article, generated by GuruFocus, is designed to provide general insights and is not tailored financial advice. Our commentary is rooted in historical data and analyst projections, utilizing an impartial methodology, and is not intended to serve as specific investment guidance. It does not formulate a recommendation to purchase or divest any stock and does not consider individual investment objectives or financial circumstances. Our objective is to deliver long-term, fundamental data-driven analysis. Be aware that our analysis might not incorporate the most recent, price-sensitive company announcements or qualitative information. GuruFocus holds no position in the stocks mentioned herein.