

Kimco Realty Corp (KIM, Financial), one of the oldest real estate investment trusts in the United States, has recently witnessed a daily gain of 5.07% and an Earnings Per Share (EPS) of 0.61. However, over the past three months, the stock has seen a loss of -15.89%. This raises the question: is Kimco Realty's stock modestly undervalued? This article aims to provide a detailed valuation analysis of Kimco Realty (KIM) to answer this question. We encourage readers to delve into the following analysis for a deeper understanding of the company's intrinsic value.
Company Overview
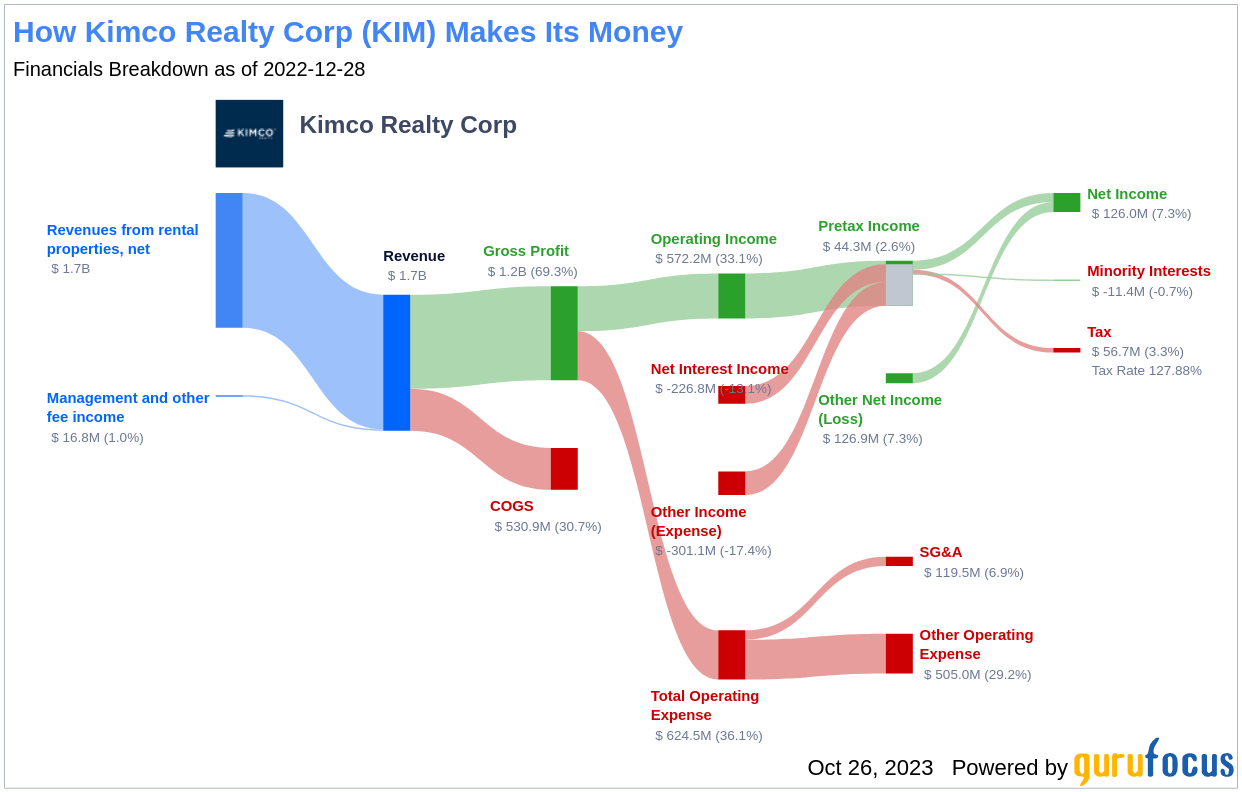
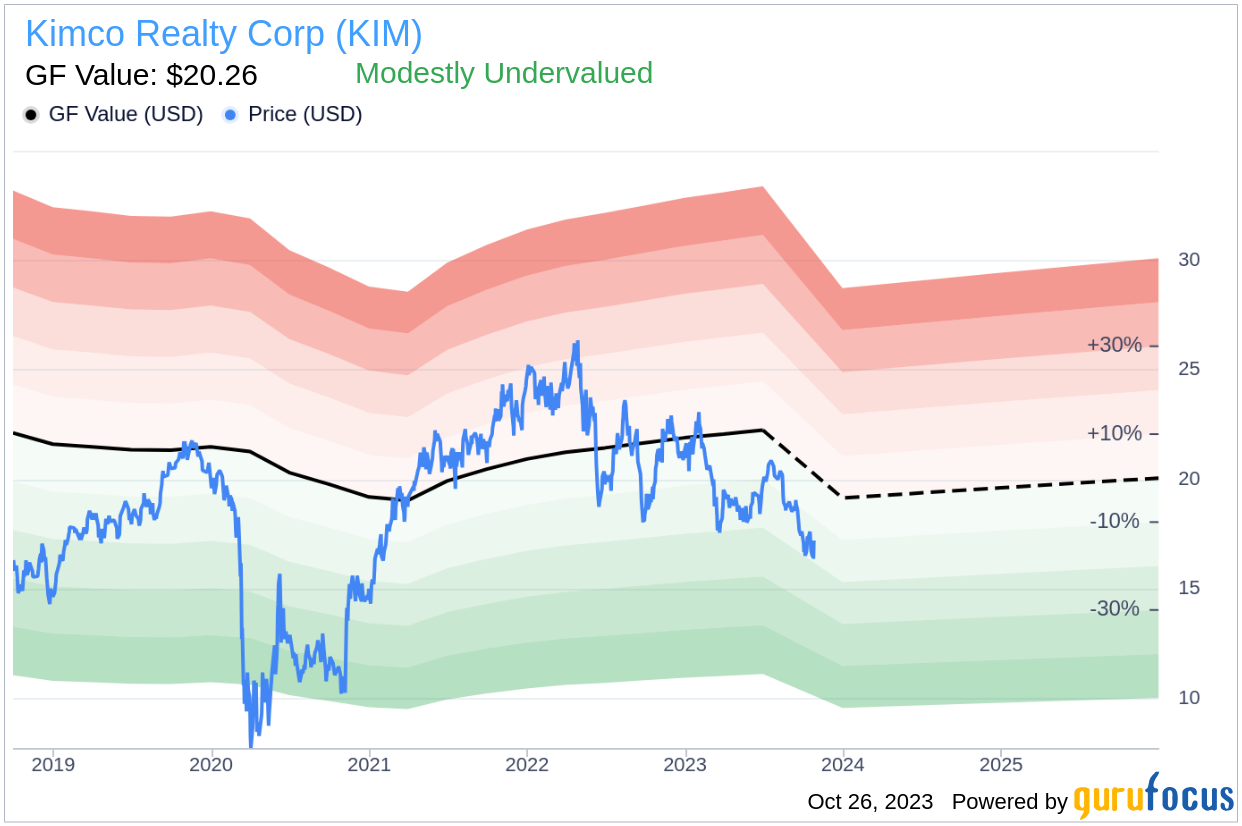
Kimco Realty Corp (KIM, Financial) owns interests in 5,282 shopping centers throughout major markets in the U.S., representing roughly 77 million square feet. With a current stock price of $17.21 per share, Kimco Realty has a market cap of $10.70 billion. When compared to its GF Value of $20.26, the stock appears to be modestly undervalued. This valuation is based on historical trading multiples, past performance, and future business performance estimates. Here is a detailed income breakdown of Kimco Realty:
Understanding GF Value
The GF Value is a proprietary measure that represents the current intrinsic value of a stock. It is calculated based on historical multiples, a GuruFocus adjustment factor based on past returns and growth, and future estimates of business performance. In the case of Kimco Realty, the GF Value indicates that the stock is modestly undervalued. This suggests that the long-term return of Kimco Realty's stock is likely to be higher than its business growth.
Financial Strength
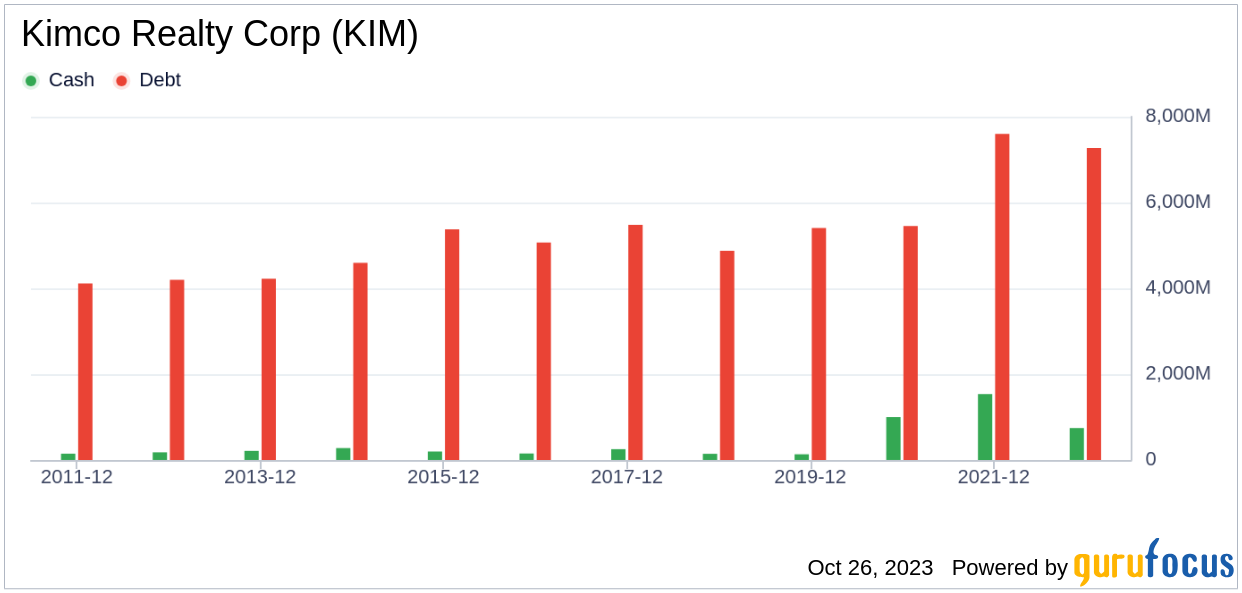
Investing in companies with poor financial strength can lead to a higher risk of permanent loss of capital. Therefore, it is crucial to review the financial strength of a company before deciding to buy its stock. Kimco Realty has a cash-to-debt ratio of 0.12, which ranks better than 65.43% of 729 companies in the REITs industry. However, GuruFocus ranks the overall financial strength of Kimco Realty at 4 out of 10, indicating that the financial strength of Kimco Realty is poor.
Profitability and Growth
Investing in profitable companies, especially those demonstrating consistent profitability over the long term, poses less risk. Kimco Realty has been profitable 10 over the past 10 years with a revenue of $1.80 billion and Earnings Per Share (EPS) of $0.61 over the past twelve months. However, its operating margin is 32.82%, ranking worse than 70.72% of 690 companies in the REITs industry.
One of the most important factors in the valuation of a company is its growth. Companies that grow faster create more value for shareholders, especially if that growth is profitable. The average annual revenue growth of Kimco Realty is 0.6%, ranking worse than 52.05% of 634 companies in the REITs industry. The 3-year average EBITDA growth is -11.6%, ranking worse than 75.42% of 537 companies in the REITs industry.
ROIC vs WACC
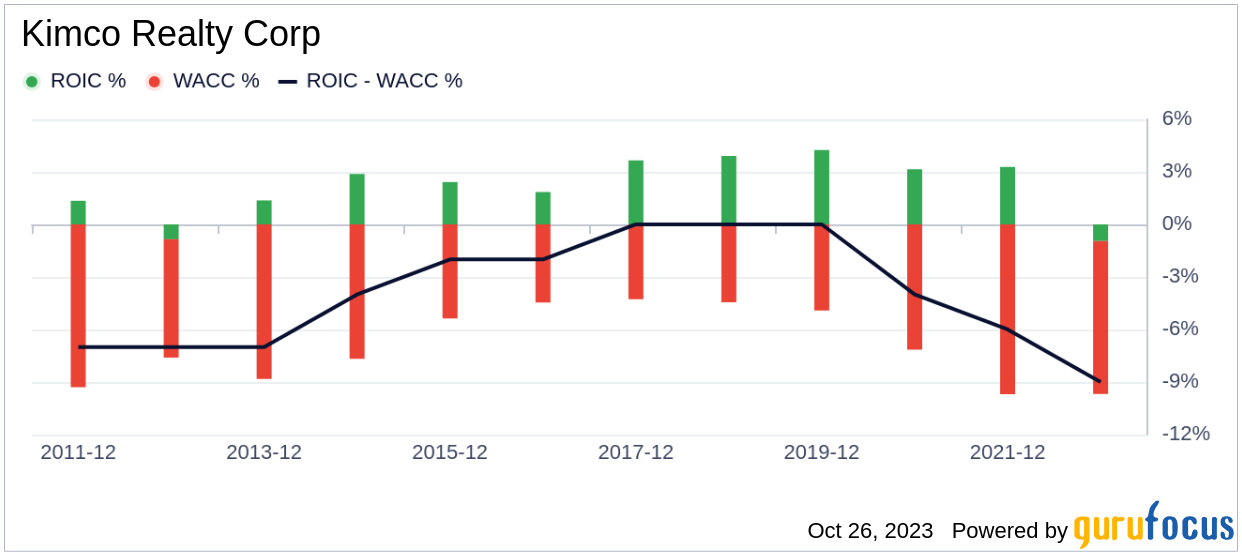
Comparing a company's return on invested capital (ROIC) to its weighted average cost of capital (WACC) is another method of determining its profitability. For the past 12 months, Kimco Realty's ROIC is 2.48, and its cost of capital is 9.09, suggesting the company is creating value for shareholders.
Conclusion
In conclusion, the stock of Kimco Realty appears to be modestly undervalued. However, the company's financial condition is poor and its profitability is fair. Its growth ranks worse than 75.42% of 537 companies in the REITs industry. To learn more about Kimco Realty stock, you can check out its 30-Year Financials here.
To find out the high-quality companies that may deliver above-average returns, please check out GuruFocus High Quality Low Capex Screener.
This article, generated by GuruFocus, is designed to provide general insights and is not tailored financial advice. Our commentary is rooted in historical data and analyst projections, utilizing an impartial methodology, and is not intended to serve as specific investment guidance. It does not formulate a recommendation to purchase or divest any stock and does not consider individual investment objectives or financial circumstances. Our objective is to deliver long-term, fundamental data-driven analysis. Be aware that our analysis might not incorporate the most recent, price-sensitive company announcements or qualitative information. GuruFocus holds no position in the stocks mentioned herein.