

Gap Inc (GPS, Financial) has shown a considerable gain of 2.78% today and a 19.55% increase over the past three months. With an Earnings Per Share (EPS) of 0.29, the question arises: is the stock modestly undervalued? This article seeks to answer this question by conducting an in-depth valuation analysis of Gap (GPS). Read on for a comprehensive exploration of Gap's intrinsic value.
Company Overview
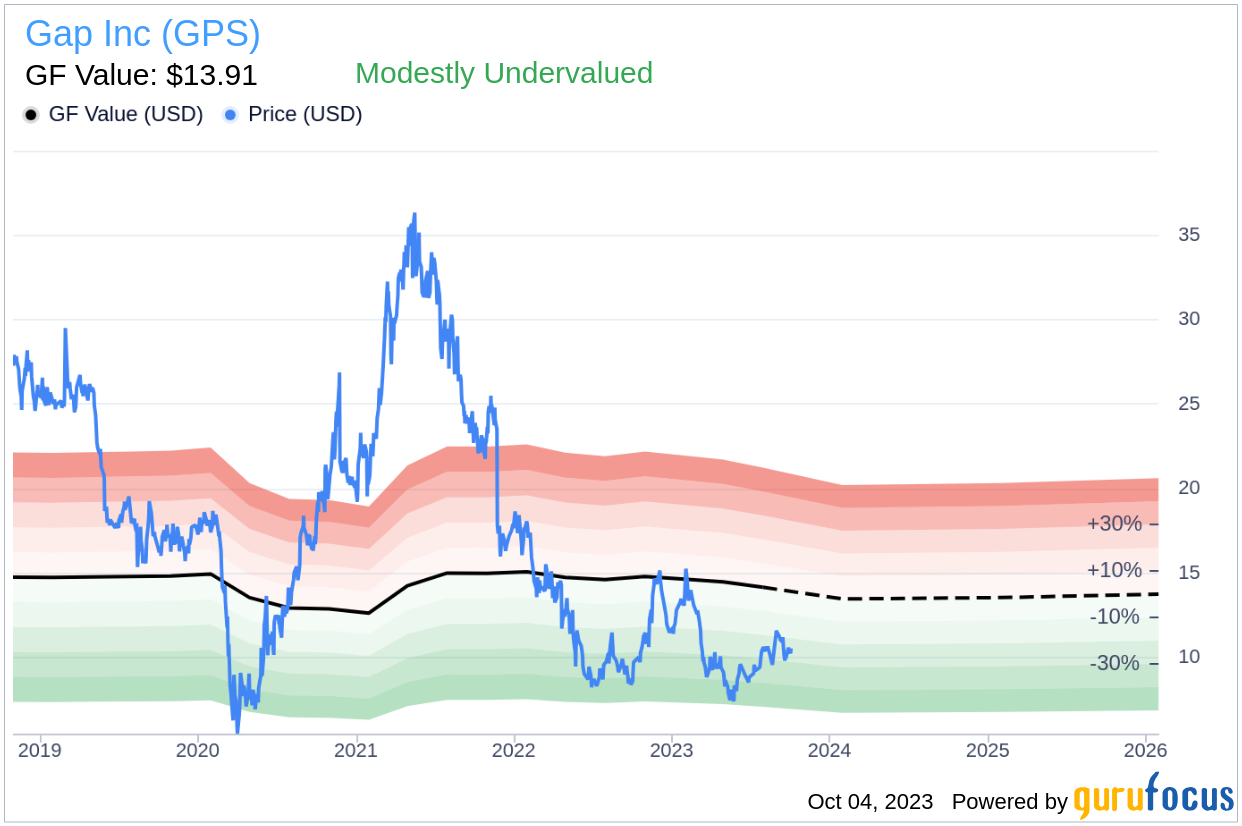
Gap Inc, founded in 1969, is a leading retailer of apparel, accessories, and personal-care products. The company operates under the Gap, Old Navy, Banana Republic, and Athleta brands, with Old Navy generating more than half of Gap's sales. Gap operates approximately 2,600 stores in North America, Europe, and Asia and franchises about 850 more in other regions. Despite a current stock price of $10.53, the GF Value estimates the fair value at $13.91, suggesting that Gap (GPS, Financial) might be modestly undervalued.

Understanding GF Value
The GF Value is a unique measure of a stock's intrinsic value. It is calculated based on three factors: historical multiples, a GuruFocus adjustment factor, and future business performance estimates. The GF Value Line gives an overview of the fair value that the stock should ideally be traded at. If the stock price is significantly above the GF Value Line, it is overvalued and its future return is likely to be poor. Conversely, if it is significantly below the GF Value Line, its future return will likely be higher.
According to GuruFocus Value calculation, Gap (GPS, Financial) appears to be modestly undervalued. This implies that the long-term return of its stock is likely to be higher than its business growth, given the current price of $10.53 per share and the market cap of $3.90 billion.
Link: These companies may deliever higher future returns at reduced risk.
Financial Strength Analysis
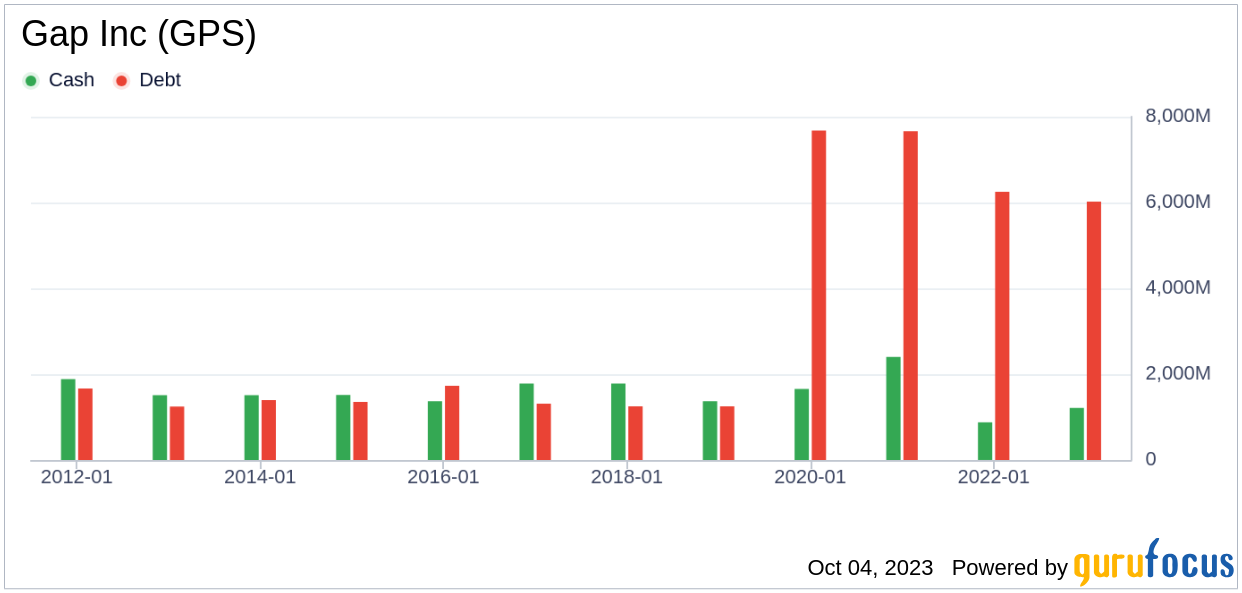
Before investing in a company, it is crucial to assess its financial strength. Companies with poor financial strength pose a higher risk of permanent loss. The cash-to-debt ratio and interest coverage are key indicators of a company's financial strength. Gap's cash-to-debt ratio of 0.24 ranks lower than 64.18% of 1097 companies in the Retail - Cyclical industry, indicating fair financial strength.
Profitability and Growth
Investing in profitable companies, particularly those with consistent profitability over the long term, poses less risk. Gap has been profitable 8 out of the past 10 years, with a revenue of $15.10 billion and an Earnings Per Share (EPS) of $0.29 in the past twelve months. However, its operating margin of 1.67% ranks lower than 61.66% of 1111 companies in the Retail - Cyclical industry.
Growth is a crucial factor in a company's valuation. A faster-growing company creates more value for shareholders, especially if the growth is profitable. However, Gap's 3-year average annual revenue growth of -0.6% and EBITDA growth rate of -24.3% rank lower than most companies in the Retail - Cyclical industry.
ROIC vs WACC
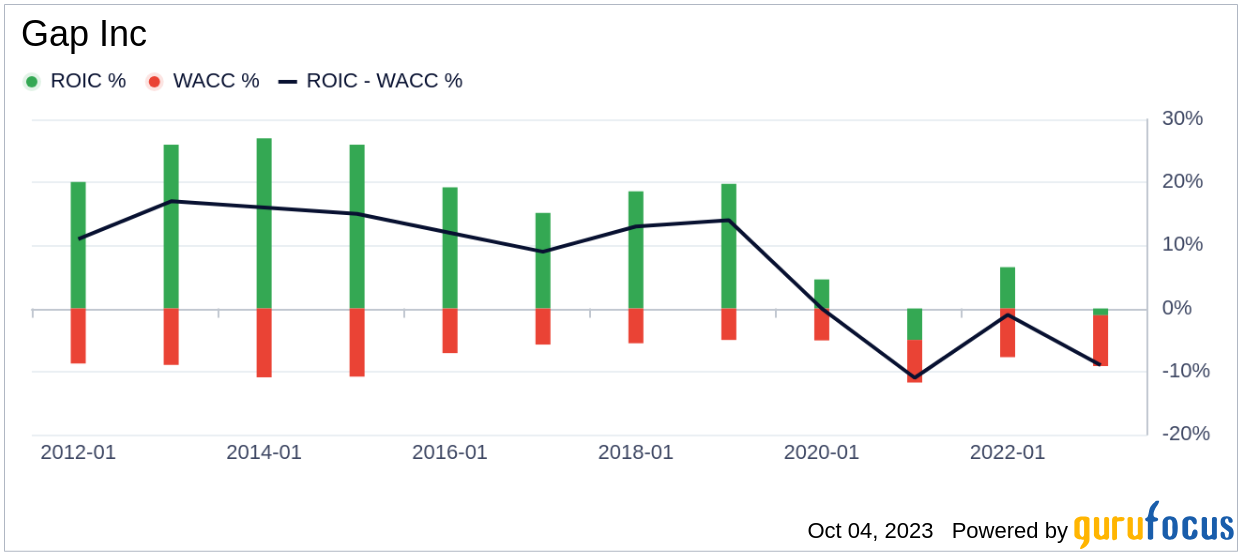
Comparing a company's return on invested capital (ROIC) to the weighted average cost of capital (WACC) can also indicate its profitability. ROIC measures how well a company generates cash flow relative to the capital it has invested in its business. WACC is the rate that a company is expected to pay on average to all its security holders to finance its assets. If the ROIC is higher than the WACC, the company is creating value for shareholders. For the past 12 months, Gap's ROIC is 1.57, and its WACC is 7.08.
Conclusion
In conclusion, the stock of Gap (GPS, Financial) shows every sign of being modestly undervalued. The company's financial condition is fair, and its profitability is fair. However, its growth ranks worse than 90.57% of 891 companies in the Retail - Cyclical industry. To learn more about Gap stock, you can check out its 30-Year Financials here.
To find out the high quality companies that may deliever above average returns, please check out GuruFocus High Quality Low Capex Screener.