

The S&P 500 Aggregate chart provides overall statistical information for all the tickers of a particular index, like the S&P 500, or tickers derived from your own screener criteria.
You will find the chart under the "Screeners" menu at the top of the home page.
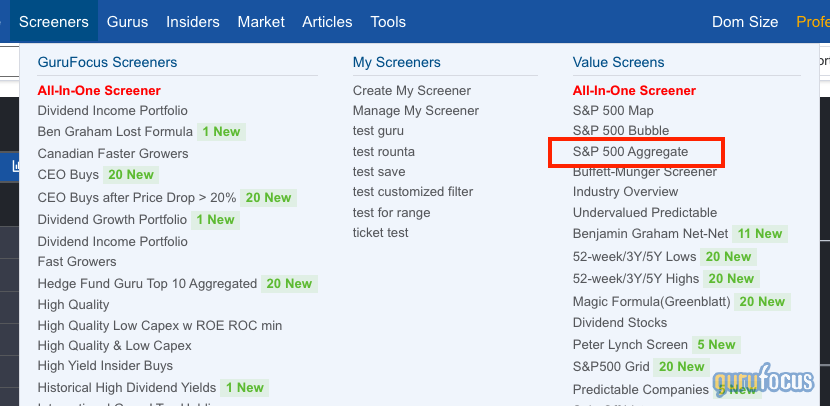
Once you select it, you will be redirected to the S&P 500 chart.
You can switch between two charts or to different indexes using the menu options on the left. By clicking “Active Filter,” you can see the stats of the stocks from your customized screener. For more details about “View” and “Filters,” please go here.

Once you’ve selected the tickers you want, you can change the indicator. By default, day’s change will be used. The overall statistics are at the top, which are median and mean. We provide a variety of different indicators, so you are not limited to what you can view.

There is an advanced feature called the “Discrete Indicator,” which displays the distribution of stocks for each bar. For example, if the “Industry” option is selected, different industries will be marked with different colors, allowing you to see the representation for each sector.

If you want to see distributions for each industry, you can switch from “Default” to “Layer.” By doing so, each industry will be split into different distribution bar charts, as the image below shows.

You can also compare the real-time aggregate data with historical data. We provide some shortcut time periods, but you may also select any month from the past five years. The historical data bar is displayed as a darker color. The real-time/past stats are displayed at the top. The Comparison feature can be combined with the Discrete Indicator.

If you have any suggestions or encounter any unexpected issues, please click the “Feedback” button at the top of the chart to report it.