In this tutorial, we will discuss how to get a detailed overview of a company’s fundamental data using the Stock PDF Report.
How to download the report
The Stock PDF Report allows you to download a 15-page report containing detailed information about a company’s financial strength, profitability, valuation, historical financial data and much more. To download a stock report, click on the “Stock Report” icon in the row of buttons begin with “Alerts.”
You can also read a web version of the Stock Report by clicking on the “Stock Report” tab. The tab also contains a blue “Download Stock Report” near the top-right corner.

View a comprehensive overview of the company
GuruFocus writes on the Manual of Stocks page that Buffett once said to make 50% a year on $1 million, you must “turn over a lot of rocks” and find the companies that are “off the map.” Page 1 of the Stock PDF report gives a one-page overview of the company, including the company’s GuruFocus business predictability rank, GF Valuation zone, GF Score and its five rank components: financial strength, profitability rank, GF Value rank, growth rank and momentum rank.

For example, International Business Machines Corp. (IBM, Financial) has a one-star business predictability rank and a GF Score of 70 out of 100, which suggests inconsistent revenue growth and modest outperformance potential based on GuruFocus’ backtesting research over the past 10-20 years.
The Manual of Stocks page also contains a snapshot of a company’s historical price and financial data and a few competitive comparison metrics to help you obtain a good picture of a stock’s fundamental health.
Study a company’s financial strength and profitability
Pages 2 and 3 give you detailed charts for a wide range of financial strength and profitability metrics, allowing you to visualize trends in a company’s sales, earnings, dividends, profit margins, and leverage ratios like cash-to-debt and debt-to-equity.
For example, IBM’s financial strength ranks 4 out of 10 based on a low cash-to-debt ratio of 0.14, a low equity-to-asset ratio of 0.15 and a high debt-to-equity ratio of 2.75. Despite this, the company’s Piotroski F-score is a high 7 out of 9.

IBM’s profitability ranks 8 out of 10 on the back of gross profit margins near a 10-year high of 59.09% and outperforming more than 62% of global competitors. Additionally, operating margins and net profit margins outperform over 76% of global competitors.

View a company’s current and historical valuation
Pages 4 and 5 give you detailed charts about a company’s valuation. While Page 4 focuses primarily on the historical price multiples like price-earnings, price-sales, price-book and price-to-free-cash-flow, Page 5 gives you valuation bands charts that allows you to see where the company’s price line compares to the company’s 10-year maximum valuation line and the company’s 10-year minimum valuation line.

The Valuation Chart gives you a stock’s current price compared to a wide range of valuation methods, including Earnings Power Value, tangible book, Graham Number, Peter Lynch Fair Value, median price-sales value and discounted cash flow.

For example, while Apple Inc. (AAPL, Financial) may be slightly undervalued based on discounted cash flow models, Apple may be overvalued based on Peter Lynch Value, median price-sales value, projected free cash flow, tangible book, Graham Number and earnings power value.
The Valuation Bands chart give alternative clues to a company’s valuation. While Apple trades close to the midpoint of the price-earnings valuation bands, the stock trades close to the upper bound based on price-sales, price-book and price-to-operating-cash-flow. These three charts suggest that Apple may be overvalued based on said valuation bands.

Get an alternative stock valuation using Peter Lynch’s earnings chart
Page 9 of the Stock PDF report gives a company’s Peter Lynch Chart, a chart that is based on legendary Fidelity Magellan Fund manager’s earnings line set at 15 times earnings. The green bars indicate the monthly price ranges while the blue line gives the valuation of the stock at the 15-year-median price-earnings ratio. The left y-axis gives earnings per share while the right y-axis gives the valuation of the stock at the given earnings per share. The black line gives the company’s dividends per share.

While Apple’s earnings have grown over the past 15 years, its price has trended above the Peter Lynch median price-earnings line since July 2019, suggesting possible overvaluation.
See how the company is doing compared to its competitors
Pages 7 and 8 of the Stock PDF report gives financial strength, profitability and valuation data for the company and its competitors within the industry.
For each comparison table, the subject company’s row is highlighted in bold so that you can see the company’s relative rank to its competitors. The financial strength and profitability comparison tables are ranked by financial strength rank and profitability rank highest to lowest. On the other hand, the valuation comparison table is ranked by price-earnings ratio lowest to highest.

For example, IBM’s financial rank of 4 lands the company toward the bottom of the financial strength comparison table. On the other hand, competitors with high financial strength include Tata Consultancy Services Ltd. (NSE:TCS, Financial), Cognizant Technology Solutions Corp. (CTSH, Financial) and EPAM Systems Inc. (EPAM, Financial).
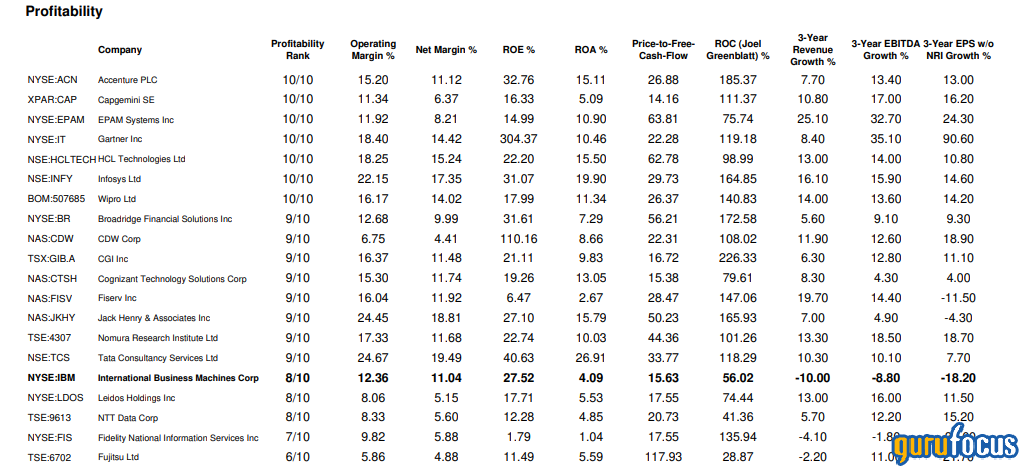
Likewise, IBM also ranks near the bottom of the profitability comparison table despite its profitability rank of 8 out of 10. Several of IBM’s competitors have a profitability rank of 10 out of 10, including Accenture (ACN, Financial), EPAM Systems (EPAM, Financial) and Gartner (IT, Financial).

In terms of valuation, IBM’s price-earnings ratio is near the middle of the pack compared to its competitors. Cognizant (CTSH, Financial) has the lowest price-earnings ratio among competitors at 15.81 while EPAM Systems (EPAM, Financial) and Fidelity National Information Services (FIS, Financial) have the highest price-earnings ratios among competitors at above 69.
Explore a company’s historical financial data
Pages 10-14 of the stock PDF report gives 15 years of detailed financial data for the company broken down into several sections:
Page 10: Per-share data and ratios
Page 11: Income statement
Page 12: Cashflow statement
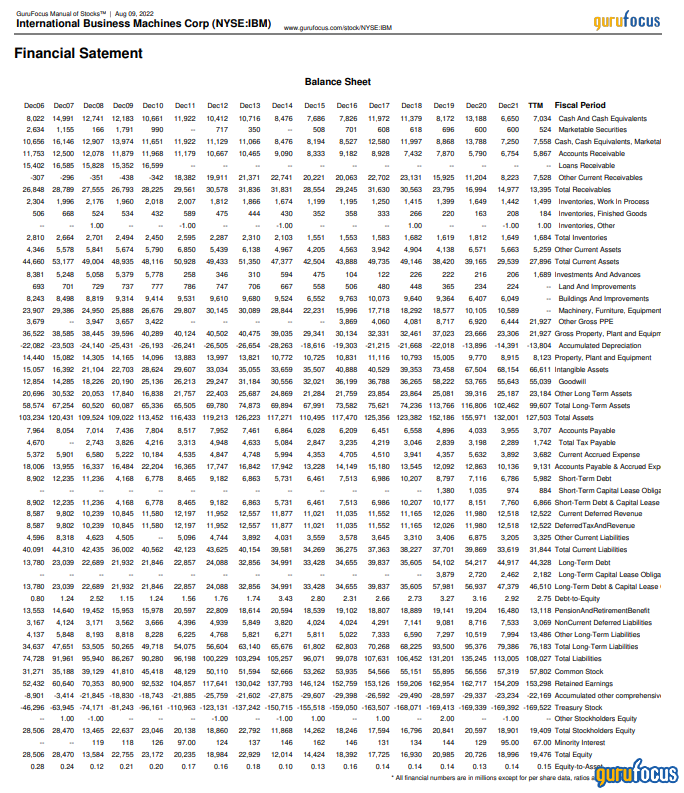
Page 13: Balance sheet
Page 14: Valuation and quality
The per-share data and ratios section gives you information about financial calculations like revenue per share, earnings per share, dividends per share, return on equity, return on assets, profit margins, and other key accounting measures.

The income statement includes key terms like revenue, gross profit, operating income and net income while the cashflow statement includes terms like free cash flow and cash flow from operations.


Lastly, the balance sheet breaks down a company’s total assets, total liabilities and total equity into terms like cash, long-term debt and stockholder’s equity. Likewise, the valuation and quality section gives you key terms like price valuations, market cap, Altman Z-score, Piotroski F-score and Beneish M-score.