

Knight-Swift Transportation Holdings Inc. (KNX, Financial) ticks several boxes for investors who want quality companies trading at reasonable prices.
The name came up through a simple screener I run from time to time. It identifies companies with financial strength and profitability rankings of at least 7 out of 10 and a PEG ratio below 1 (at or below fair value).
You might also find it if you search for stocks with GF Scores of at least 90 out of 100. With a score of 94, Knight-Swift is obviously an outperformer among companies in all industries.

What is it about this company that produces such metrics?
About Knight-Swift
The company was formed in 2017 following the merger of two trucking companies, Knight Transportation Inc. and Swift Transportation Co.
The industry divides itself into two segments: full-load and less-than-truckload. Generally, full-load carriers pick up and deliver full trailer loads, from a single shipper to a single customer, with no sorting or processing along the way.
Knight-Swift calls itself the industry’s largest full truckload company. It operates a fleet of 19,000 tractors and 58,000 trailers; it employs 24,000 people and has its headquarters in Phoenix.
In addition, it offers a “full complement of truckload and logistics services throughout the U.S., Mexico and Canada.” Indeed, through acquisitions and other initiatives, it has significantly diversified its range of services:

As this slide from the first-quarter 2022 presentation makes clear, revenues from LTL and logistics are growing quickly.
Competition
The company does not name its competitors in its 10-K filing, but there are several other truckload companies with significant market share: Schneider National Inc. (SNDR, Financial), Werner Enterprises Inc. (WERN, Financial), Landstar System Inc. (LSTR, Financial) and U.S. Xpress Enterprises Inc. (USX, Financial). This chart shows how the top three have performed over the past decade:

According to Knight-Swift’s annual filing, competition involves three key elements: customer service and relationships, price and capacity. It added that customer service and capacity become more important when demand is strong, while pricing is the key factor when demand is weak.
As for competitive advantages, the company noted, “We believe our fleet capacity, terminal network, customer service and breadth of services offer a competitive advantage to major shippers, particularly in times of rising freight volumes when shippers must quickly access capacity across multiple facilities and regions.”
Financial strength

Knight-Swift’s debt has grown in recent years. At the end of calendar year 2016, before the merger, Knight had a total debt per share of just 31 cents. It has since jumped to $11.80 per share, doubling in the past year alone:

Despite that growth, the company has a healthy interest coverage ratio of 45.31, meaning it generates enough operating income to pay its interest expense more than 45 times over.
Also worth noting in this table: the WACC versus ROIC percentages. Return on invested capital (9.50%) has a relatively narrow edge over the weighted average cost of capital (8.06%).
Prior to the merger, the Knight half of the new company had anemic free cash flow results. Two years after the merger, FCF began to grow:

Profitability

Knight-Swift enjoys a high ranking for profitability, built on respectable margins and returns.
The cherry on top, though, is it has been profitable for each of the past 10 years, a record that sets it atop the industry. According to GuruFocus, that record is better than 99.89% of its 915 peers and competitors in the transportation industry.
In part, that’s because of good growth numbers:
- Three-year revenue growth rate: 6.1%.
- Three-year Ebitda growth rate: 18.3%.
- Three-year earnings per share without non-recurring items growth rate: 23.5%.
It is always reassuring to see a company that can grow its Ebitda and earnings per share more quickly than its revenue. This indicates the company is becoming more effective or efficient in its operations.
Dividends and buybacks

Continuing a practice started by Knight, the combined company pays a quarterly dividend. For 2022, the company increased it by 20%, from 10 cents to 12 cents. The stock closed at $47.05 on Wednesday, providing a yield of 0.87%, which is below the industry average. The payout ratio is low at just 9%, leaving lots of room for further increases.
Shareholders also have been rewarded with modest share repurchases over the past couple of years, after seeing significant dilution in 2017 and 2018:

The issuance binge was part of Knight’s all-stock purchase of Swift (announced in April 2017 and completed in September 2017).
Valuation
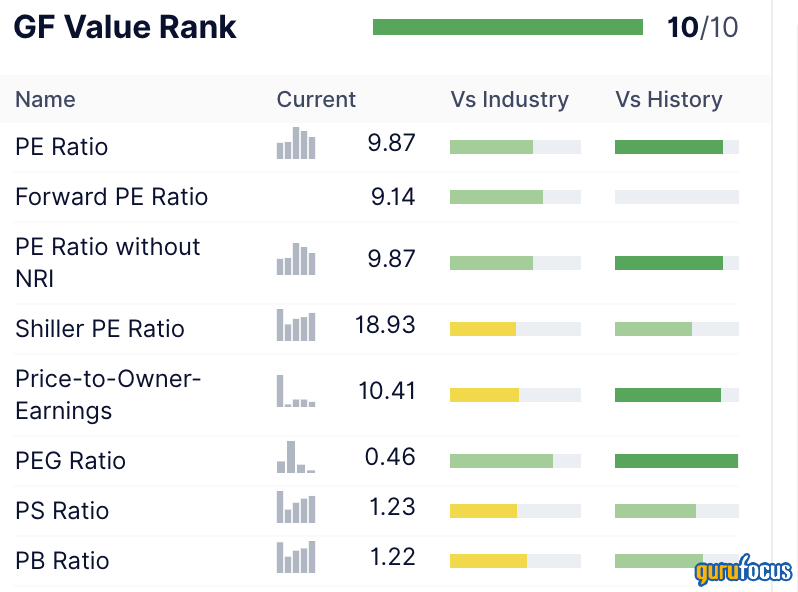
Knight-Swift receives a full 10 out of 10 for value. Contributing factors include a price-earnings ratio of 9.87, well below the industry average of 13.51.
Divide that price-earnings ratio with an annual Ebitda growth rate averaging 21.40% per year and you have a PEG ratio of just 0.46. That indicates an undervalued stock.
The GF Value chart concludes Knight-Swift is modestly undervalued, thanks to a serious pullback that began at the start of 2022:

To some extent, this is an industry pullback as well as one specific to the company. As we saw in the comparative performance chart above, the downtrend also pulled in its two biggest competitors, Schneider National and Werner Enterprises. That Knight-Swift fell more may reflect the proposition that the bigger they are, the harder they fall.
The discounted cash flow calculator concludes there is a 58.91% margin of safety available at a price of $47.05. That’s using the 10-year earnings per share without NRI growth rate of 12.90%. However, investors should take this result with caution; Knight-Swift has an earnings predictability rating of just one out of five stars.
In any case, it seems reasonable to assume the company is undervalued to some degree. However, we do not know if it has bottomed out.
Gurus
Five guru investors held stakes in Knight-Swift at the end of the first quarter of 2022:
- Jim Simons (Trades, Portfolio)' Renaissance Technologies owned 535,327 shares, good for a 0.33% stake in the company and representing 0.03% of its assets under management.
- Steven Cohen (Trades, Portfolio) of Point72 Asset Management held 242,178 shares.
- Ray Dalio (Trades, Portfolio) of Bridgewater Associates held 92,842 shares.
The company was a new holding for both Simons' firm and Cohen, while Dalio reduced his position during the quarter by just over 40%.
Conclusion
Knight-Swift easily meets the criteria of quality fundamentals plus low PEG screener. That’s backed up by its high GF Score of 94.
As GuruFocus notes, “The GF Score is found to be closely correlated to the long-term performances of stocks. It ranges from 0 to 100, with 100 as the highest.” It adds that stocks with scores of 91 to 100 have the highest outperformance potential.
This company should get the attention of growth investors who want solid future performance without paying too much. Value investors will pass it by because of its debt load, and income investors can find better opportunities elsewhere.