

GuruFocus is excited to announce an update to the All-in-One Screener, a favorite feature of GuruFocus users that allows you to screen for stocks using a wide variety of criteria, create customized criteria and backtest strategies.
The update includes an improved user interface, a new way to modify criteria and a GF Score chart view.
User interface
The user interface has been updated to make the All-in-One Screener more intuitive and easier to use.
For example, when searching for stocks in specific industries, you can now type the industry name in the search bar in order to find it faster, show selected industries or clear selected industries, as shown in the image below.

The interface for the customized data series has also been updated. It is now easier and faster for the customized criteria to be switched between active and inactive using the toggle, as shown below.

Important: If you see red numbers in your customized filter, do not fret! The red number is not necessarily an error. If you can click "confirm" to save your customized filter, than there is no error in your filter and thus, you can save your filter with no problem.
Modify criteria
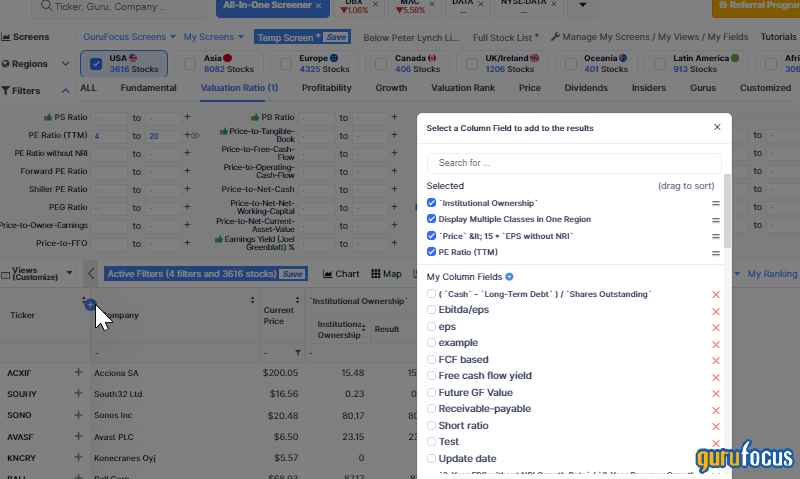
GuruFocus has also added a new way to modify the criteria in the All-in-One Screener. After you have selected your preferred criteria, you can modify them directly in the results rather than having to scroll all the way back up and change to separate tabs. All you need to do for this is click on the range below the column label. When you change the criteria here, it will also be changed automatically in the screener above.

There is also a new shortcut to add statistics to the view of your screener results. Adding things to the view allows you to see other metrics on the stocks that meet your screening criteria, without adding said metrics as criteria in their own right. The shortcut is in the form of a blue “+” icon located between the column headers for “ticker” and “company.”
GF Score view
By default, the results of the All-in-One Screener are displayed in list format, but there are also different formats you can view the results in, such as charts, map, bubble and aggregate.
Following the debut of the GF Score, a ranking system that has been found to be closely correlated to the long-term performances of stocks by backtesting from 2006 to 2021, GuruFocus has added a new GF Score section to the chart view in the All-in-One Screener results. You can navigate to it by selecting “chart” and “GF Score.”
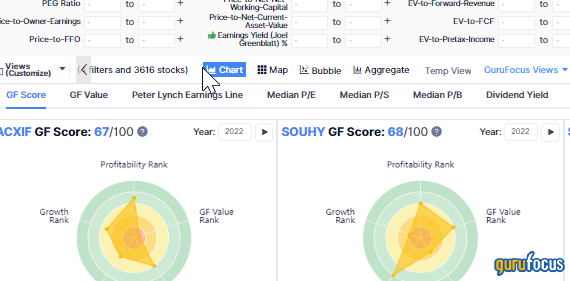
The GF Score is based on the five key aspects of analysis: Financial Strength, Profitability, Growth, Valuation and Momentum.