

Users can access a few premade templates for both the Excel Add-in and Google Sheets add-on, including the stock summary template that gives a snapshot of key fundamental information about a company.
The stock summary template gives key information about the company, including the company name, market sector, business predictability rank and a five-year historical price chart. The template also displays the company’s GF Score and its five component rankings: profitability rank, GF Value rank, momentum rank, financial strength rank and growth rank.
Excel Add-in version Access
To access the Excel Add-in templates, please first install the Excel Add-in using the steps outlined in the Getting Started guide. You can then download the templates by clicking on the “Explore Templates” button on the Excel Add-in page.

Select the desired template to download and then, click on the Download Template button.

Excel Add-in template usage
Enter the stock ticker in Cell B11. Do not change the formulas in the other cells. You can add additional fields in the orange section located in Cells G52 to H69.

As the above screen shot illustrates, the stock summary template gives fundamental data like business predictability rank, five-year historical price and dividend yield, the GF Score and its five components: financial strength, profitability, GF Value, growth and momentum.

The Excel Add-in version also allows you to retrieve geographic segment revenue data and business segment revenue data. Enter the year to report geographic segment data in Cell B71 and the year to report business segments data in Cell B91. You can then change the charts as needed using Excel’s Chart Options feature.

Google Sheets Add-on Access
To access the Google Sheets templates, please first install the Google Sheets add-on using the steps outlined in the Quick Start Guide. Then, click on the “Explore Templates” button.

You can also access the templates directly within the add-on by clicking the “Templates” button in the GuruFocus Tools dashboard.

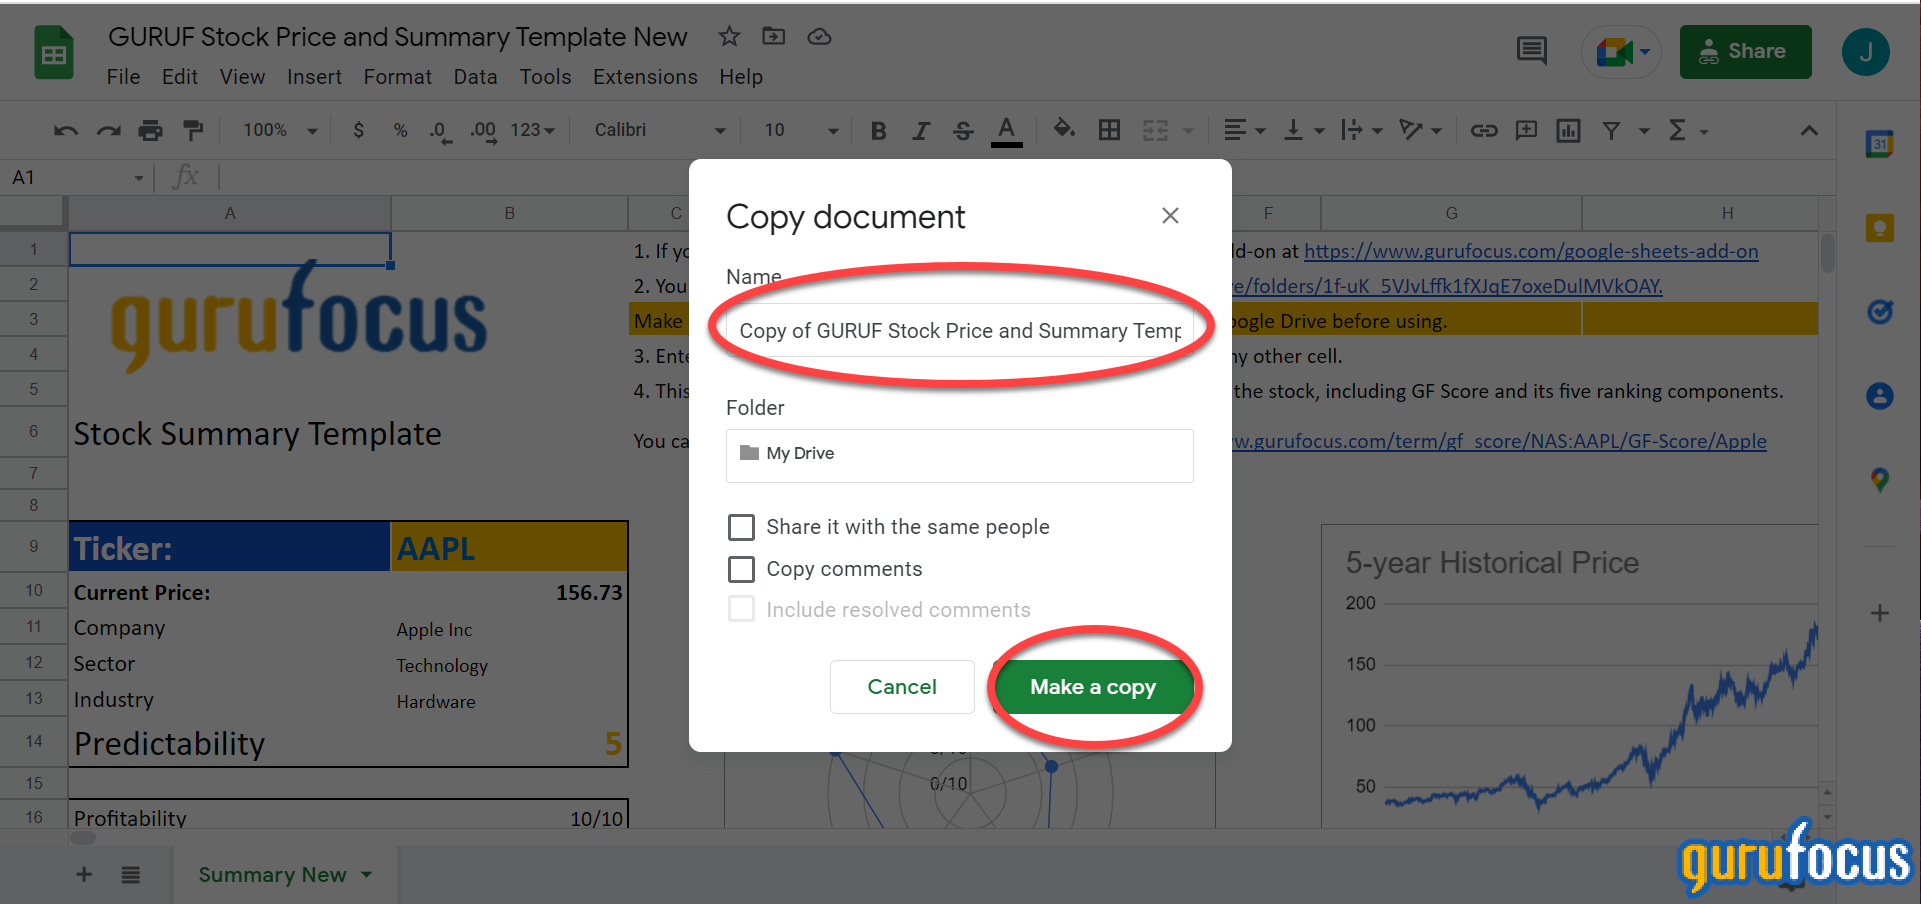
Make sure you save a local copy of the template before using the template. Click on the “File” menu and select “Make a copy.”

Enter the desired name of your copy and click the green “Make a copy” button to save a copy into your Google Drive.
Google Sheets Version Usage
Enter the stock ticker in Cell B9. Do not change the formulas in the other cells.

If you have any questions about our Google Sheets feature, please contact us. Users can also book a demo of the Google Sheets feature by clicking on the “Book a Demo” button.
