

We are happy to announce a new feature where you can measure the percentage of stock overvaluation or undervaluation: the GuruFocus Fair Value Line.
Background
Legendary value investor Peter Lynch, who managed the Fidelity Magellan Fund during the 1980s, developed a "quick way" to determine if a stock is overvalued or undervalued: simply compare a stock's price line to a hypothetical earnings line assuming a price-earnings ratio of 15. Figure 1 illustrates a sample Peter Lynch chart for Walmart Inc. (WMT, Financial).

Figure 1
As Figure 1 illustrates, we can see that Walmart is likely overvalued based on Peter Lynch's legendary chart.
Lynch also warned that cyclical companies tend to have higher profit margins at the peaks of economic cycles, resulting in artificially-low price-earnings ratios.
GF Value Line gives a new way to value stocks using an exclusive method
The GF Value Line gives a stock's intrinsic value based on GuruFocus' own valuation method. The website's calculation considers the following three factors:
- Historical price-valuations, including price-earnings, price-sales, price-book and price-to-free-cash-flow
- A GuruFocus adjustment factor based on the company's past returns and growth
- Future estimates of business performance
Figure 2 illustrates a sample GF Value Line for Walmart.

Figure 2
The GF Value Chart contains the following elements:
- The light-blue line gives the stock's historical prices.
- The black solid line gives the stock's intrinsic values based on the GF Value line, while the dotted line gives the stock's estimated, future intrinsic values assuming the GF Value factors hold.
- The GF Value Chart then shows a red section and a green section, with lighter sections close to the GF Value Line and darker sections further away.
- If the light-blue price line is inside the red section, the stock is overvalued based on our GF Value model. Lighter-red sections indicate modest overvaluation while darker-red sections indicate significant overvaluation.
- If the light-blue price line is inside the green section, the stock is undervalued based on our GF Value model. Lighter-green sections indicate modest undervaluation while darker-green sections indicate significant undervaluation.
As Figure 2 illustrates, Walmart's price line is within the dark-red section of the Chart, suggesting modest overvaluation.
Figure 3 illustrates another GF Value Chart for Apple Inc. (AAPL, Financial), the top holding of Warren Buffett (Trades, Portfolio)'s Berkshire Hathaway Inc. (BRK.A, Financial)(BRK.B, Financial).

Figure 3
As Figure 3 illustrates, Apple's price line is located in the darkest-red section, suggesting significant overvaluation. GuruFocus ranks Apple's valuation 1 out of 10 on the heels of price valuations underperforming over 88% of global competitors. As Figure 4 illustrates, Apple is trading close to its 10-year maximum price-sales valuation.
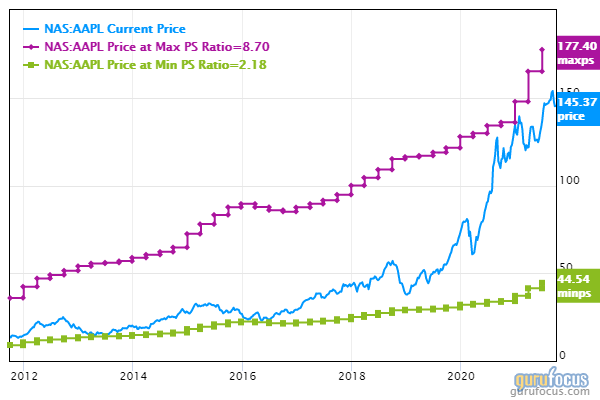
Figure 4
You can also screen using the Price-to-GF-Value filter
GuruFocus Premium members can screen for undervalued stocks using the Price-to-GF-Value filter. For example, suppose we screen for stocks where the Price-to-GF-Value filter is less than 0.80. Figure 5 illustrates the filter activated underneath the Valuation Ratio tab.

Figure 5
Figure 6 illustrates the GF Value Chart for Intel Corp. (INTC, Financial), a stock with a price-to-GF-Value ratio of 0.78 as of Monday.

Figure 6
As Figure 6 illustrates, Intel's price line is within the light-green sections, suggesting modest undervaluation.
Disclosure: The author is long Apple and Intel.
Read more here:
- 5 Tech Stocks With High Gross Margins Over the Past 5 Years
- New GuruFocus Screener Feature: Historical Data Screener
- 4 Gold Stocks Broadly Owned by Gurus
Not a Premium Member of GuruFocus? Sign up for a free 7-day trial here.