

With a daily loss of 12.5% and a 3-month loss of 4.66%, Tidewater Inc (TDW, Financial) currently trades at $59.57 per share. Despite an Earnings Per Share (EPS) of 0.94, the stock appears to be significantly overvalued. This article takes a closer look at the company's valuation and financials, providing valuable insights for potential investors. Keep reading to find out more.
Understanding Tidewater Inc (TDW, Financial)
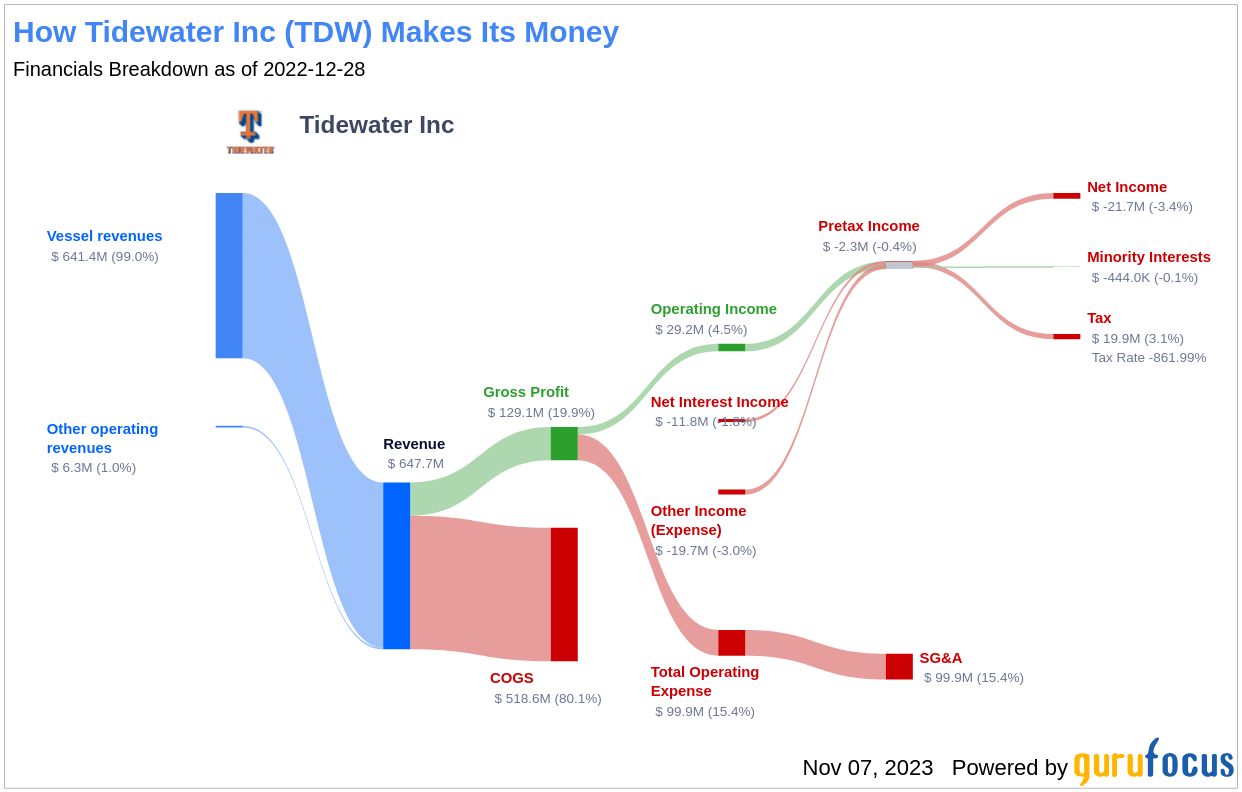
Tidewater operates in the offshore energy industry, providing offshore service vessels and marine support services. The company's vessels and associated services support all phases of offshore exploration, field development, and production. Tidewater's operations span the Americas, Asia Pacific, Middle East, Europe/Mediterranean, and West Africa, with the majority of its revenue derived from West Africa.
Analyzing Tidewater's GF Value
The GF Value is a proprietary measure of a stock's intrinsic value, calculated based on historical trading multiples, a GuruFocus adjustment factor based on past performance and growth, and future business performance estimates. The GF Value Line is a representation of the stock's ideal fair trading value. If the stock price is significantly above the GF Value Line, it is considered overvalued and its future return is likely to be poor. Conversely, if it is significantly below the GF Value Line, its future return will likely be higher.
According to GuruFocus' valuation method, Tidewater (TDW, Financial) appears to be significantly overvalued. The stock's fair value is estimated based on historical multiples, an internal adjustment based on the company's past business growth, and analyst estimates of future business performance. At its current price of $ 59.57 per share, Tidewater stock appears to be significantly overvalued. As a result, the long-term return of its stock is likely to be much lower than its future business growth.

Link: These companies may deliver higher future returns at reduced risk.
Evaluating Tidewater's Financial Strength
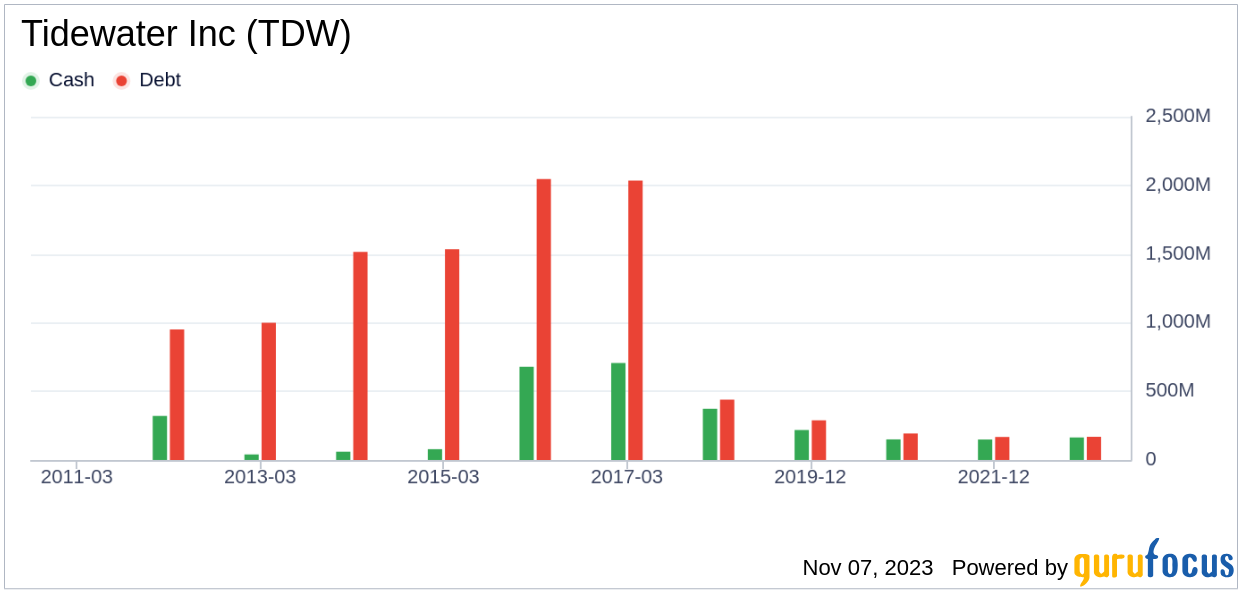
Investing in companies with low financial strength could result in permanent capital loss. Therefore, it's crucial to review a company's financial strength before deciding whether to buy shares. Tidewater has a cash-to-debt ratio of 0.94, which ranks better than 58.4% of 1036 companies in the Oil & Gas industry. Based on this, GuruFocus ranks Tidewater's financial strength as 8 out of 10, suggesting a strong balance sheet.
Assessing Tidewater's Profitability and Growth
Investing in profitable companies carries less risk. Tidewater has been profitable 2 years over the past 10 years. During the past 12 months, the company had revenues of $786.60 Mil and Earnings Per Share (EPS) of $0.94. Its operating margin of 11.94% is better than 56.74% of 987 companies in the Oil & Gas industry. However, GuruFocus ranks Tidewater's profitability as poor.
Growth is a crucial factor in the valuation of a company. The faster a company is growing, the more likely it is to be creating value for shareholders. The 3-year average annual revenue growth rate of Tidewater is 4.8%, which ranks worse than 61.27% of 865 companies in the Oil & Gas industry. The 3-year average EBITDA growth rate is 0%, which ranks worse than 0% of 829 companies in the Oil & Gas industry.
Comparing Tidewater's ROIC and WACC
Return on invested capital (ROIC) measures how well a company generates cash flow relative to the capital it has invested in its business. The weighted average cost of capital (WACC) is the rate that a company is expected to pay on average to all its security holders to finance its assets. Over the past 12 months, Tidewater's ROIC was 5.81, while its WACC came in at 11.82.

Conclusion
In summary, Tidewater (TDW, Financial) appears to be significantly overvalued. The company's financial condition is strong, but its profitability is poor. Its growth ranks worse than 0% of 829 companies in the Oil & Gas industry. To learn more about Tidewater stock, you can check out its 30-Year Financials here.
To find out the high quality companies that may deliver above average returns, please check out GuruFocus High Quality Low Capex Screener.
This article, generated by GuruFocus, is designed to provide general insights and is not tailored financial advice. Our commentary is rooted in historical data and analyst projections, utilizing an impartial methodology, and is not intended to serve as specific investment guidance. It does not formulate a recommendation to purchase or divest any stock and does not consider individual investment objectives or financial circumstances. Our objective is to deliver long-term, fundamental data-driven analysis. Be aware that our analysis might not incorporate the most recent, price-sensitive company announcements or qualitative information. GuruFocus holds no position in the stocks mentioned herein.